Published: 2026-06-16T01:03:31.000Z
Chart USD/JPY Update: Higher in consolidation from 159.53 low
1
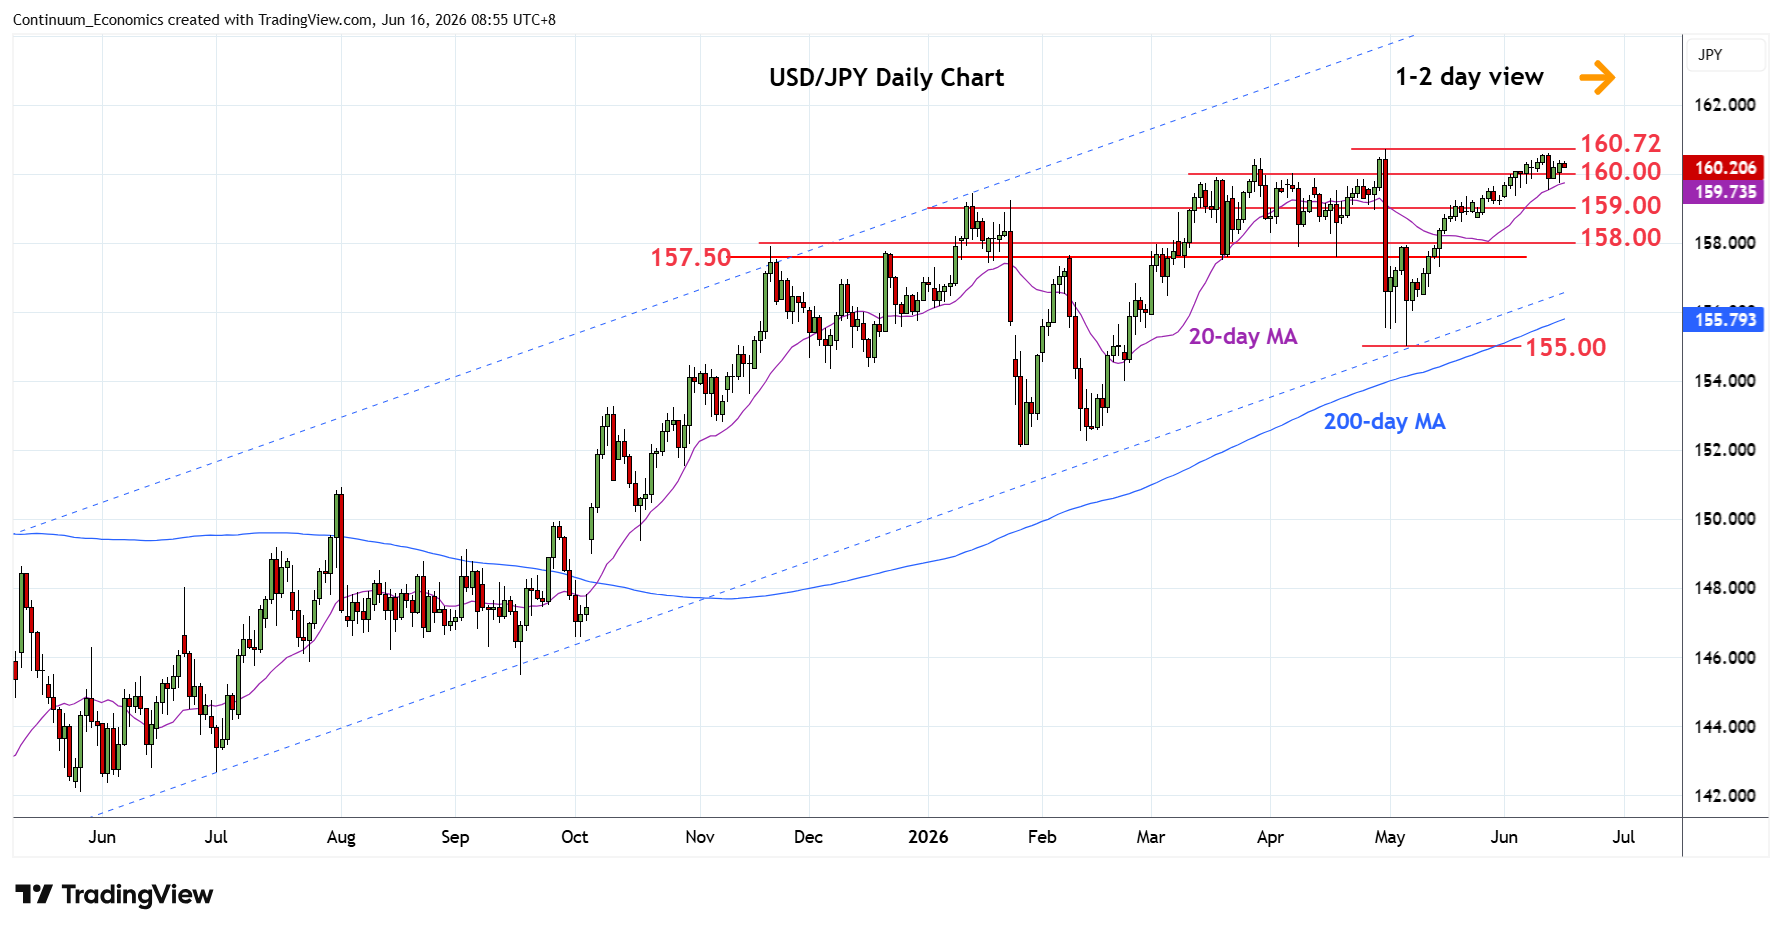
Higher in range above the 160.00 level following bounce from the 159.53 pullback low
| Levels | Imp | Comment | Levels | Imp | Comment | |||
|---|---|---|---|---|---|---|---|---|
| R4 | 161.95 | ** | Jul 2024 multi-year high | S1 | 159.53 | * | 11 Jun low | |
| R3 | 161.00 | * | figure | S2 | 159.00 | * | congestion | |
| R2 | 160.72 | ** | 30 Apr YTD high | S3 | 158.60 | * | 18 May low | |
| R1 | 160.60 | * | 11 Jun high | S4 | 158.00 | ** | congestion |
Asterisk denotes strength of level
01:00 GMT - Higher in range above the 160.00 level following bounce from the 159.53 pullback low. Daily studies are unwinding overbought readings and suggest consolidation giving way to deeper pullback to retrace recent strong gains from the 155.00 May low. Would take break of the 159.53 low to open up room for deeper pullback to support at the 159.00/158.60 congestion and 18 May low. Meanwhile, resistance at the 160.60/160.72 highs are expected to cap. Above these will extend the broader gains from 2024 year low towards 161.95, July 2024 multi-year high.