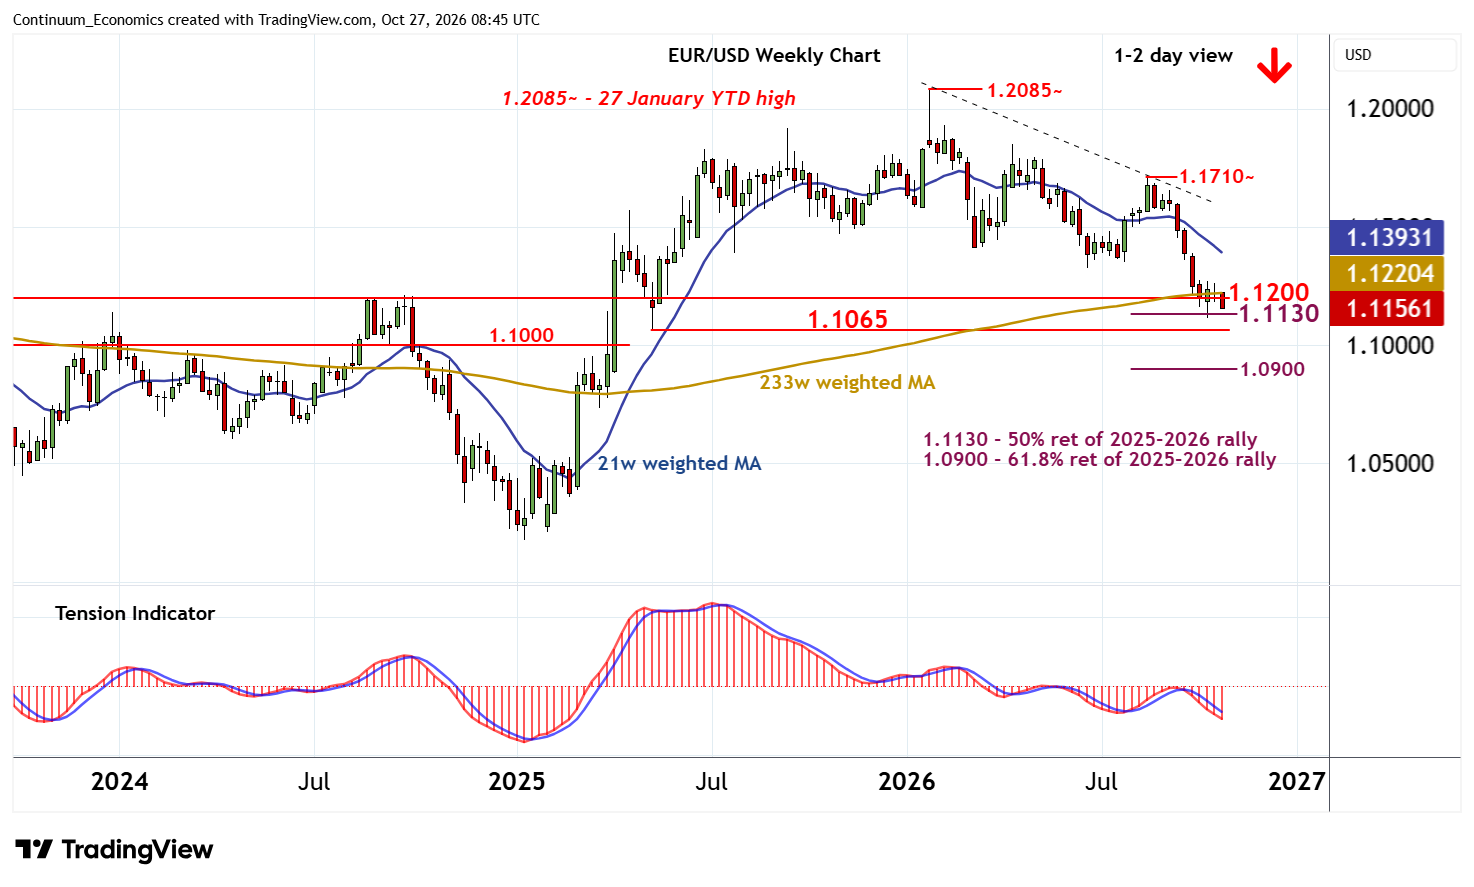
Chart EUR/USD Update: Approaching critical supports
Cautious trade above 1.1200 has given way to anticipated selling interest
| Levels | Imp | Comment | Levels | Imp | Comment | |||
|---|---|---|---|---|---|---|---|---|
| R4 | 1.1300 | ** | congestion | S1 | 1.1130 | ** | 50% ret of 2025-2026 rally | |
| R3 | 1.1270/80 | ** | 16 Oct (w) high; break level | S2 | 1.1100/15 | ** | figure; 14 Oct YTD low | |
| R2 | 1.1250 | congestion tops | S3 | 1.1065 | ** | 12 May (m) low | ||
| R1 | 1.1200 | ** | break level | S4 | 1.1000 | ** | congestion |
*Asterisk denotes strength of level
08:35 GMT - Cautious trade above 1.1200 has given way to anticipated selling interest, as intraday studies remain under pressure, with focus turning to strong support at the 1.1130 Fibonacci retracement. Just lower is critical support at 1.1100 and the 1.1115 current year low of 14 October Overbought daily stochastics are unwinding and the positive daily Tension Indicator is showing signs of flattening, suggesting room for a test of this range. However, mixed/negative weekly charts and bearish longer-term readings highlight room for a later break and continuation of January losses, initially to the 1.1065 monthly low of 12 May.
Meanwhile, a close back above 1.1200, if seen, would help to stabilise price action and prompt range extension beneath 1.1250.