Published: 2026-09-22T13:06:29.000Z
Chart USD/JPY Update: Choppy in range - daily studies rising
2
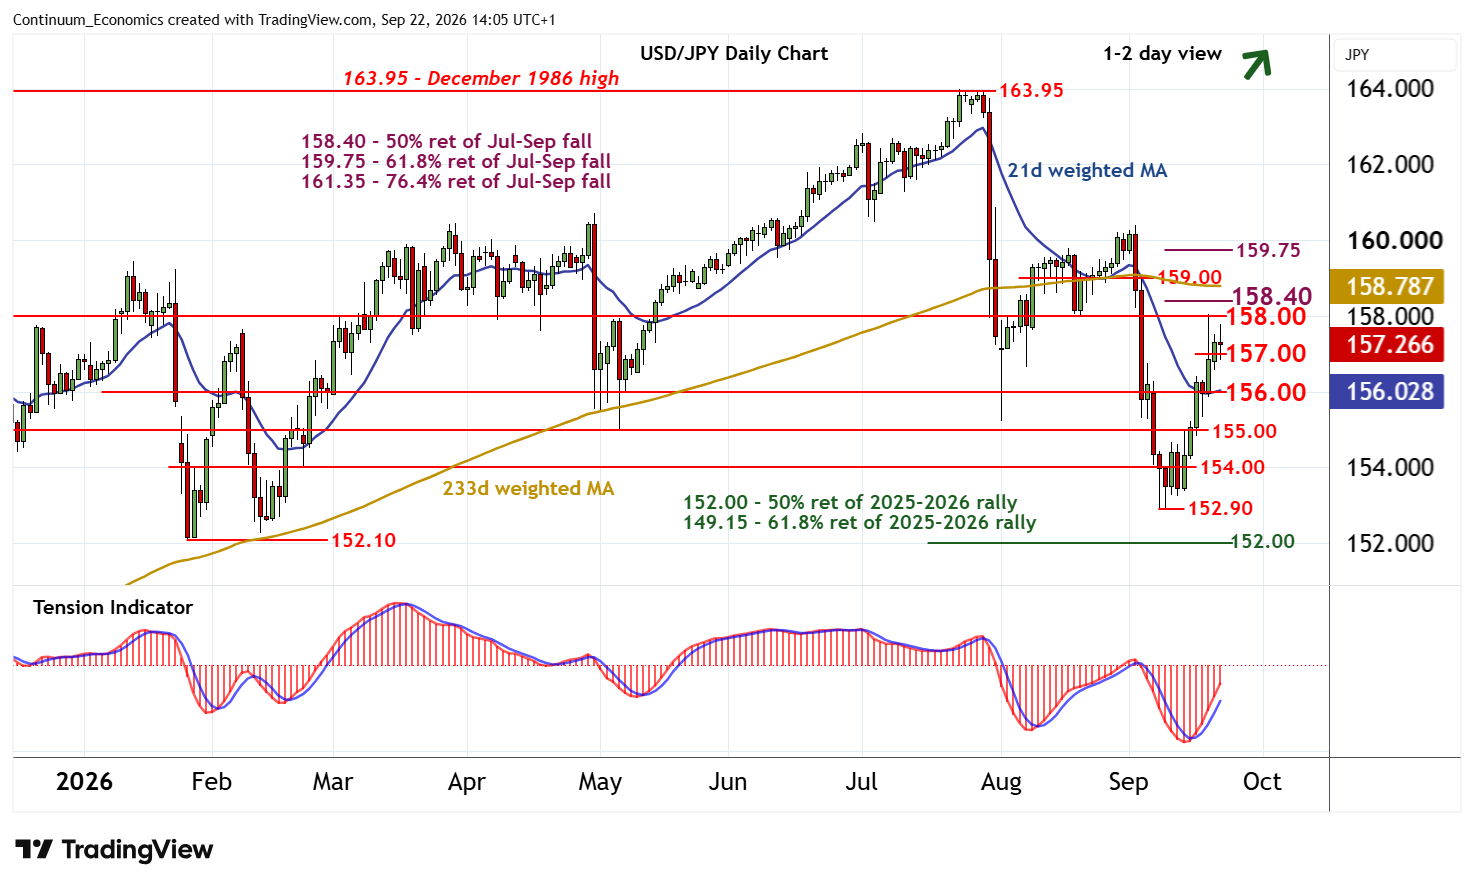
The test of congestion support at 157.00 has bounced from 156.80
| Levels | Imp | Comment | Levels | Imp | Comment | |||
|---|---|---|---|---|---|---|---|---|
| R4 | 159.75 | ** | 61.8% ret of Jul-Sep fall | S1 | 157.00 | congestion | ||
| R3 | 159.00 | * | congestion | S2 | 156.00 | * | congestion | |
| R2 | 158.40 | ** | 50% ret of Jul-Sep fall | S3 | 155.00 | * | congestion | |
| R1 | 158.00 | ** | congestion | S4 | 154.50 | minor congestion |
Asterisk denotes strength of level
13:50 BST - The test of congestion support at 157.00 has bounced from 156.80, with prices currently balanced in fresh consolidation around 157.25. Daily readings continue to rise and oversold weekly stochastics are ticking higher, suggesting room for a move back to congestion resistance at 158.00. However, the bearish weekly Tension Indicator and deteriorating longer-term charts should limit any further gains in profit-taking/consolidation beneath the 158.40 Fibonacci retracement.
Meanwhile, a close below 157.00, if seen, will help to stabilise sentiment and prompt consolidation above congestion support at 156.00.