Published: 2026-10-19T06:12:05.000Z
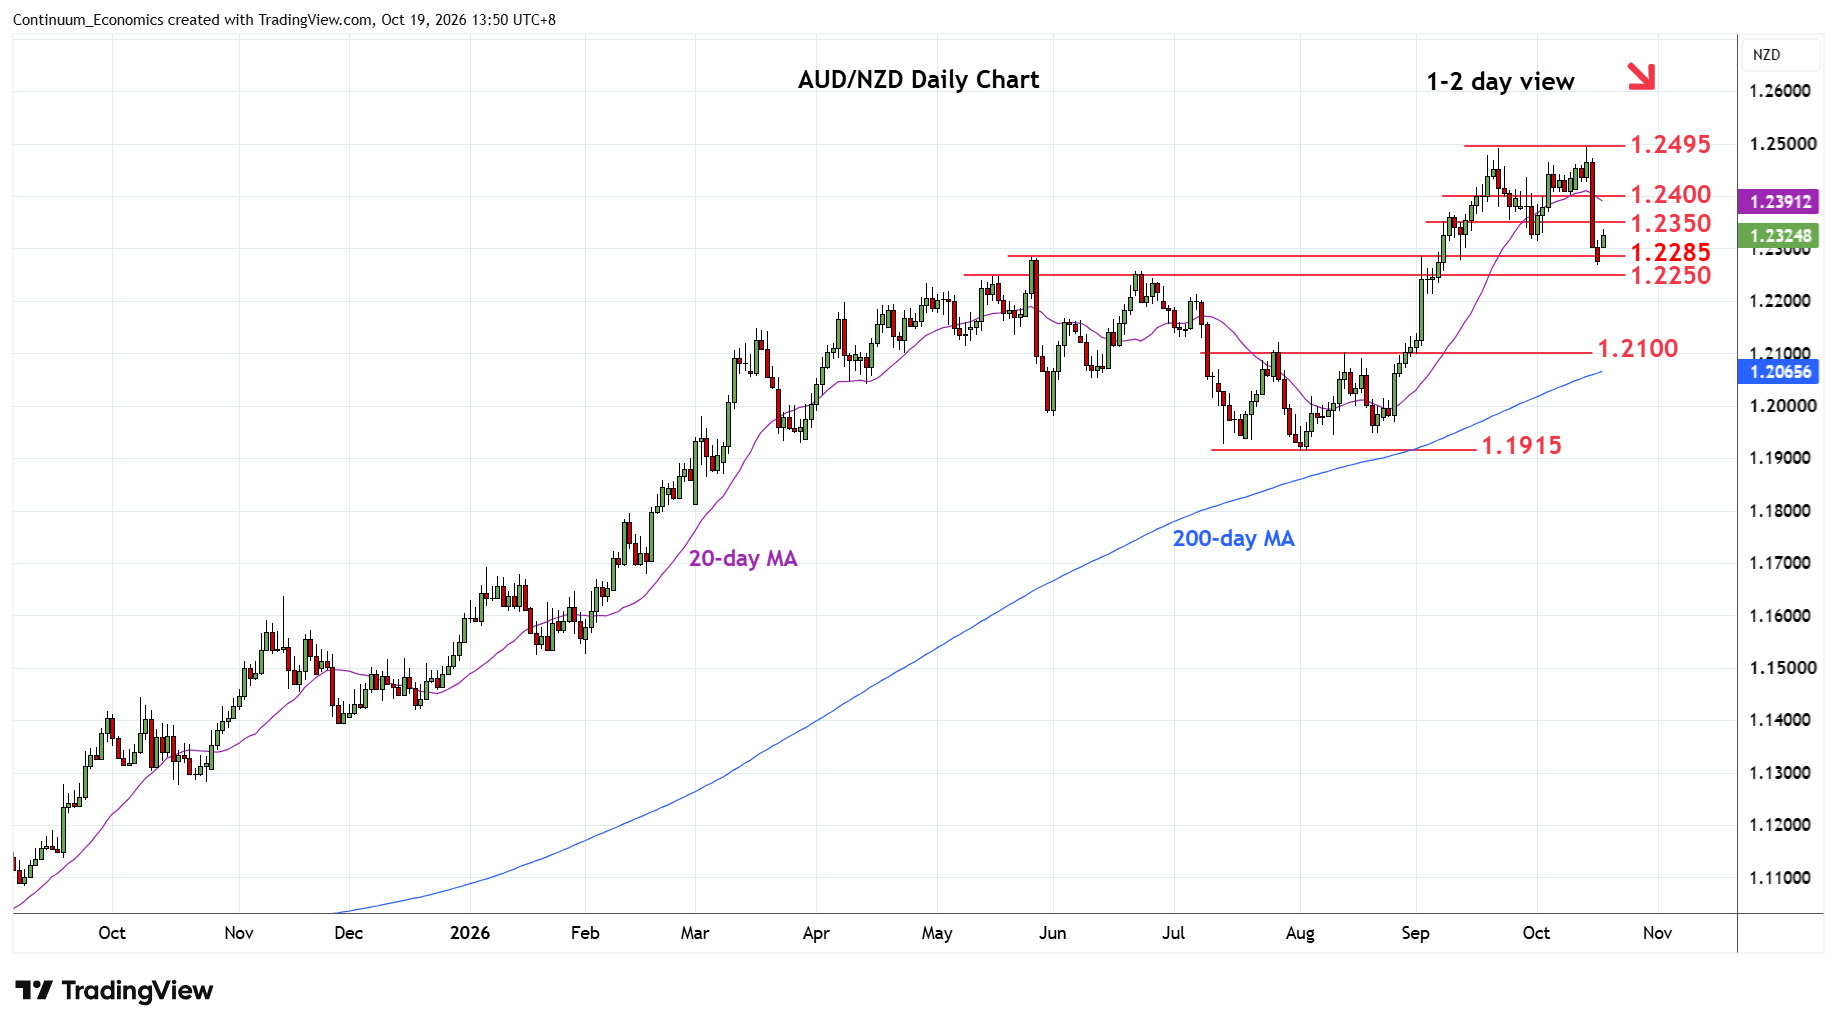
Chart AUD/NZD Update: Consolidating test of 1.2285/50 support
1
Turned up from support at the 1.2285/50 May high and congestion area as prices consolidate sharp losses from the 1.2495 current year high of last week
| Level | Comment | Level | Comment | |||||
|---|---|---|---|---|---|---|---|---|
| R4 | 1.2550 | * | congestion | S1 | 1.2285 | ** | May high | |
| R3 | 1.2490/95 | ** | Sep/14 Oct YTD highs | S2 | 1.2250 | * | congestion | |
| R2 | 1.2400 | * | congestion | S3 | 1.2200 | * | 50% Aug/Oct rally | |
| R1 | 1.2350 | * | congestion | S4 | 1.2150 | * | congestion |
Asterisk denotes strength of level
06:10 GMT - Turned up from support at the 1.2285/50 May high and congestion area as prices consolidate sharp losses from the 1.2495 current year high of last week. Daily and weekly studies are unwinding overbought readings and suggest consolidation giving way to fresh selling pressure later to retrace gains from the 1.1915, August low. Lower will see room to 1.2200 congestion and 50% Fibonacci retracement. Meanwhile, resistance remains at the 1.2350 congestion which is expected to cap and sustain losses from the 1.2490/1.2495 highs.