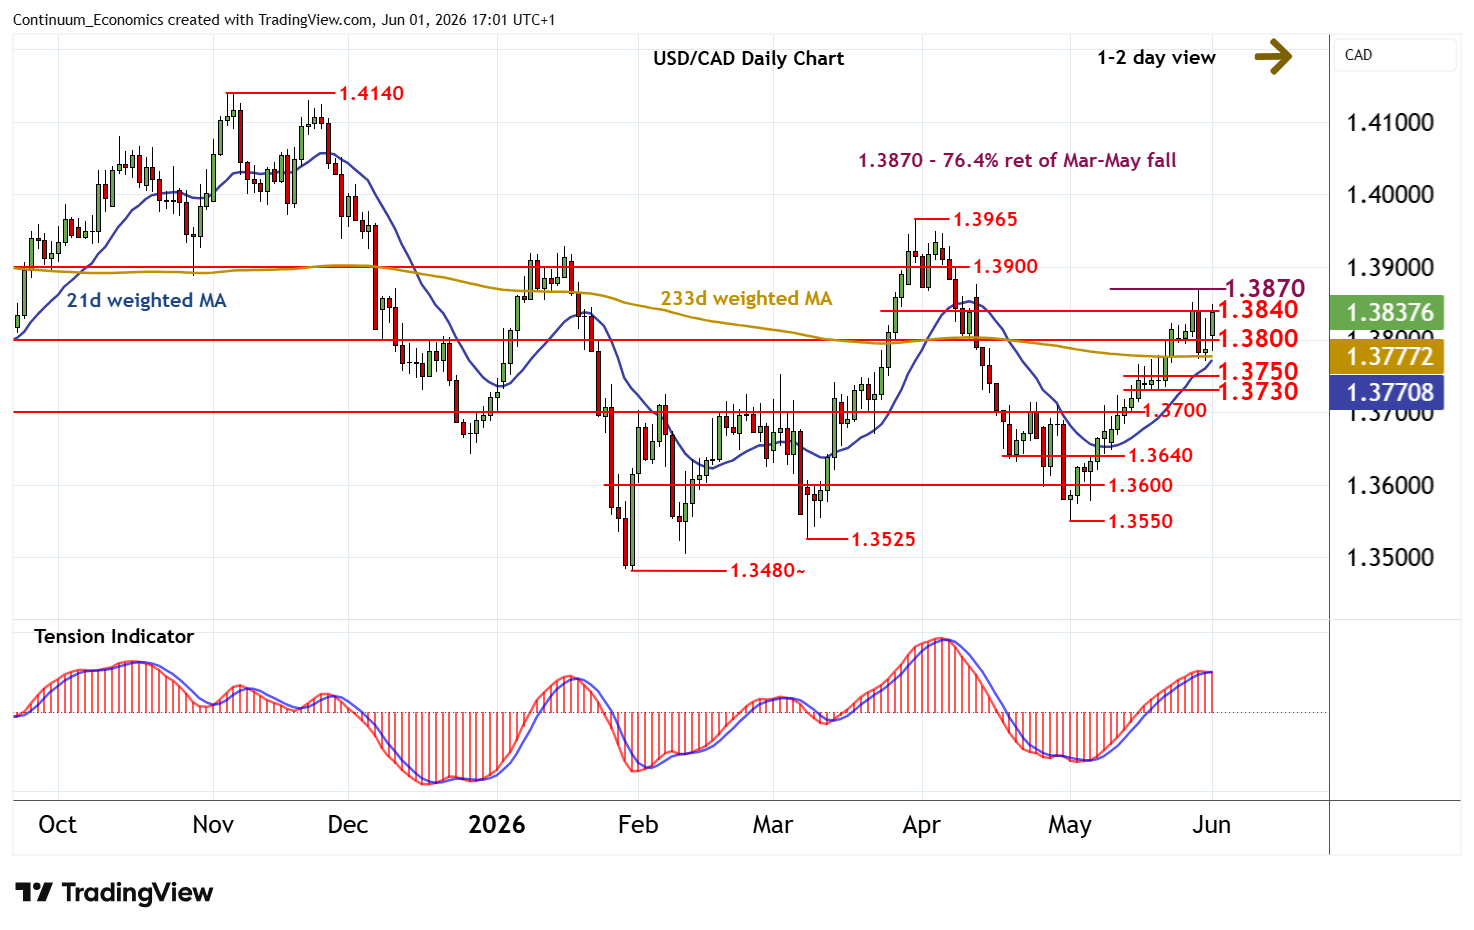
Chart USD/CAD Update: Strong resistance at the 1.3870 Fibonacci retracement
Choppy trade has given way to a fresh break higher in both USD- and CAD-driven trade
| Levels | Imp | Comment | Levels | Imp | Comment | |||
|---|---|---|---|---|---|---|---|---|
| R4 | 1.3965 | ** | 31 Mar YTD high | S1 | 1.3800 | * | congestion | |
| R3 | 1.3900 | ** | congestion | S2 | 1.3770 | 29 May (w) low | ||
| R2 | 1.3870 | ** | 76.4% ret of Mar-May fall | S3 | 1.3750 | congestion | ||
| R1 | 1.3840 | intraday break level | S4 | 1.3730 | * | recent lows |
Asterisk denotes strength of level
16:00 BST - Choppy trade has given way to a fresh break higher in both USD- and CAD-driven trade, with prices currently pressuring resistance at 1.3840. Rising intraday studies highlight room for a test above here. But deteriorating daily readings should limit any immediate break in renewed selling interest towards the 1.3870 Fibonacci retracement. Broader weekly charts continue to rise. But a close above 1.3870 is needed to turn sentiment positive and extend May gains towards congestion around 1.3900. Meanwhile, support is raised to congestion around 1.3800. A close back beneath here will add weight to sentiment and put focus on further congestion around 1.3750.