Chart USD Index DXY Update: Balanced beneath fresh year high - background studies rising
Little change, as deteriorating intraday studies and a tick lower in overbought daily stochastics keep near-term sentiment cautious
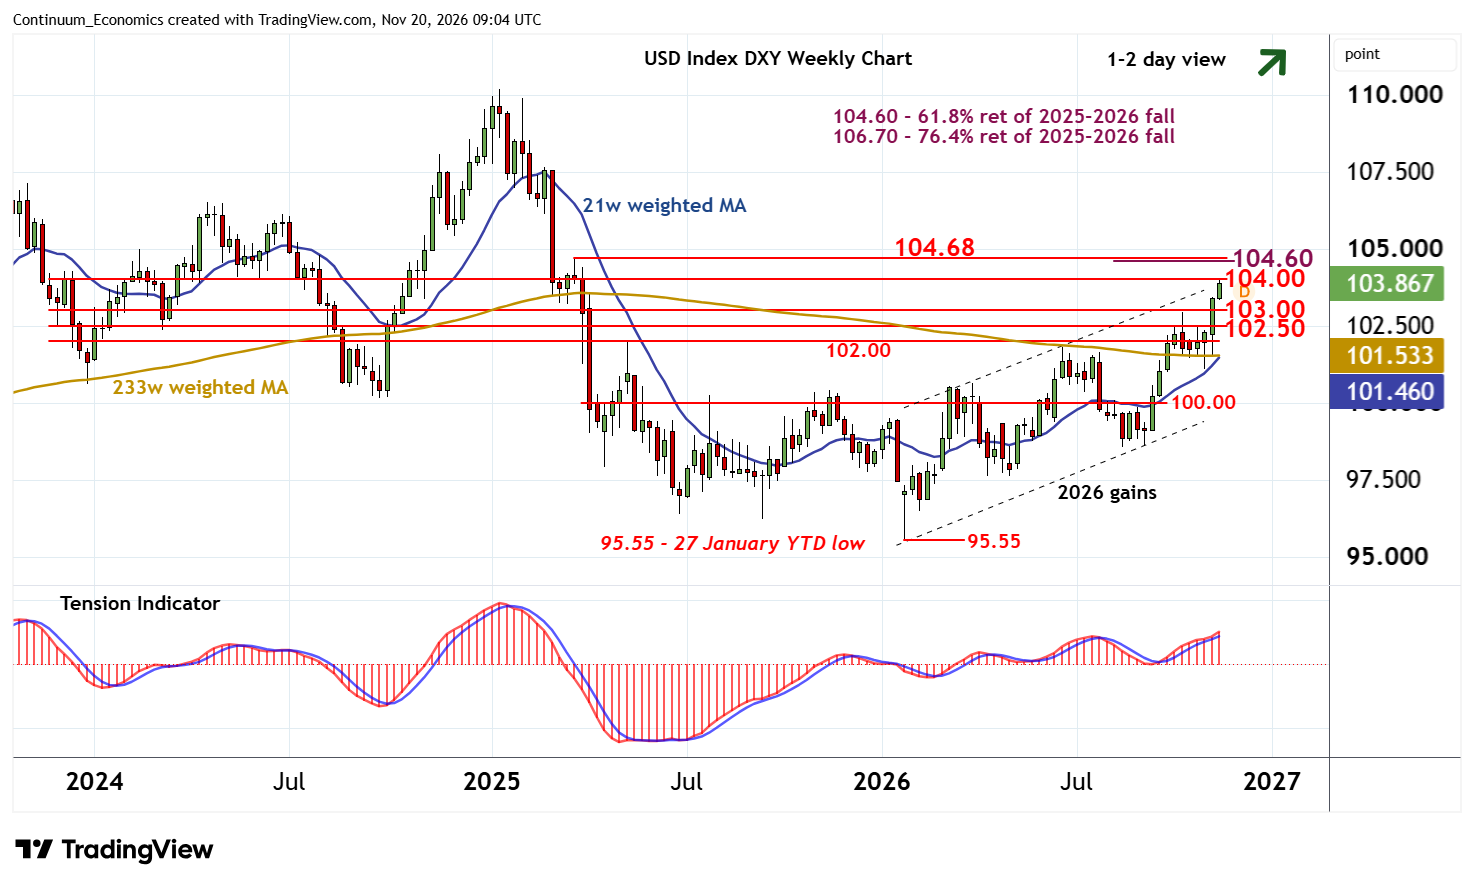
| Levels | Imp | Comment | Levels | Imp | Comment | |||
|---|---|---|---|---|---|---|---|---|
| R4 | 105.50 | congestion | S1 | 103.50 | congestion | |||
| R3 | 105.00 | ** | congestion | S2 | 103.00 | ** | congestion | |
| R2 | 104.60/68 | ** | 61.8% ret; late-Mar 2025 (w) high | S3 | 102.50 | congestion | ||
| R1 | 103.97/00 | ** | 19 Nov YTD high; congestion | S4 | 102.00 | ** | congestion |
Asterisk denotes strength of level
08:50 GMT - Little change, as deteriorating intraday studies and a tick lower in overbought daily stochastics keep near-term sentiment cautious and extend consolidation beneath resistance at the 103.97 fresh year high of 19 November and congestion around 104.00. However, the daily Tension Indicator continues to rise and broader weekly charts are positive, suggesting any tests below congestion support at 103.50 should give way to renewed buying interest above further congestion around 103.00.
Following cautious/corrective trade, fresh gains are looked for. However, a close above 104.00 is needed to turn sentiment positive once again and extend January gains towards strong resistance at the 104.60 Fibonacci retracement and the 104.68 weekly high of late-March 2025.