Published: 2026-06-01T08:40:11.000Z
Chart AUD/USD Update: Higher in range - daily studies improving
1
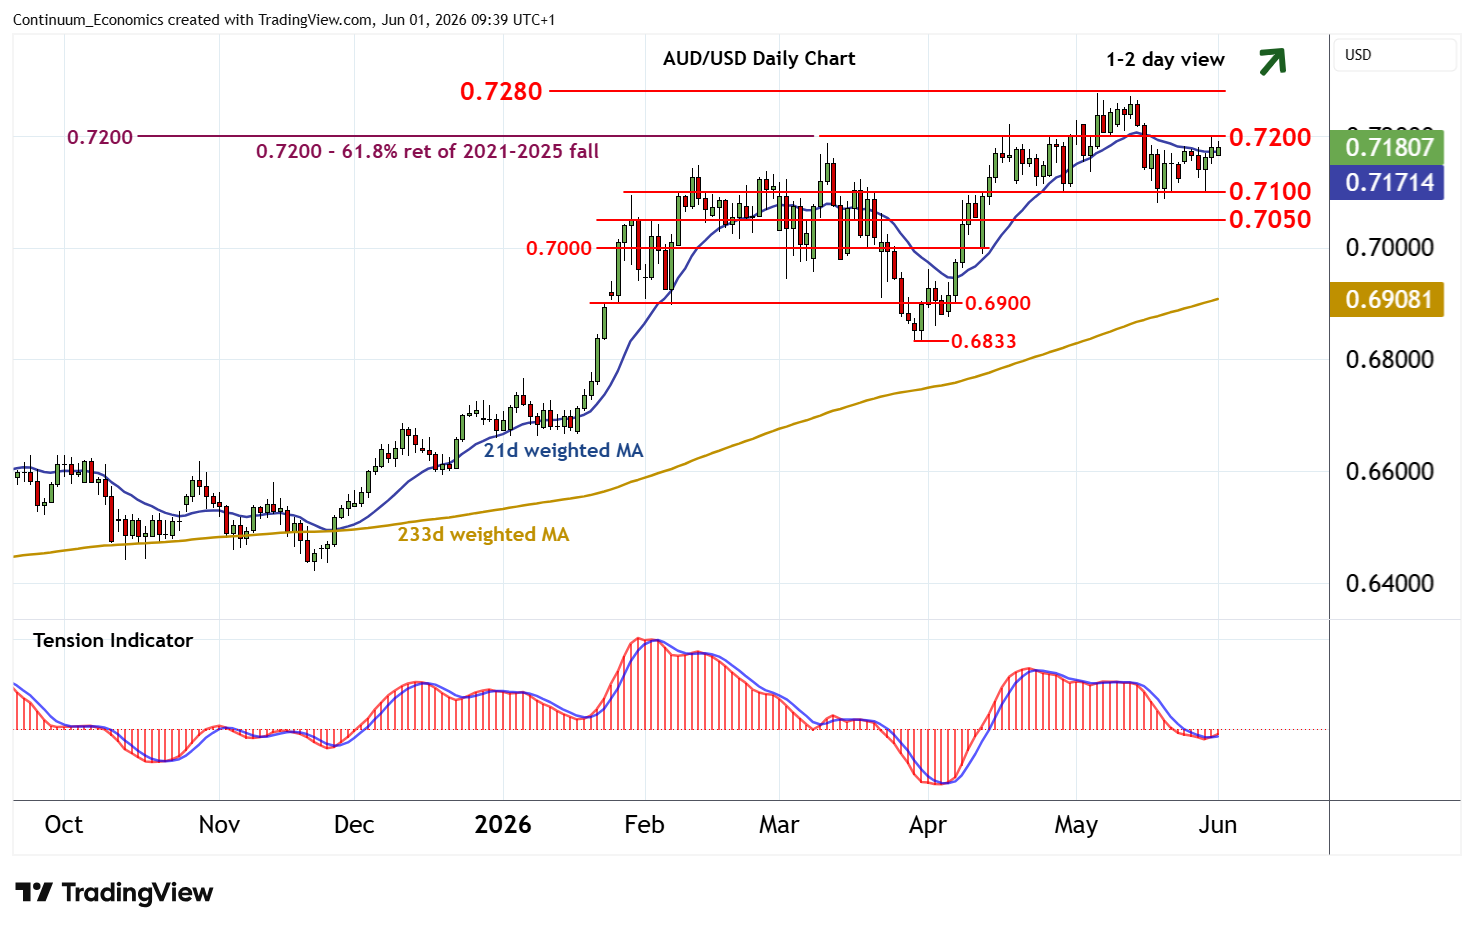
The anticipated test of resistance at 0.7200 is giving way to consolidation
| Levels | Imp | Comment | Levels | Imp | Comment | |||
|---|---|---|---|---|---|---|---|---|
| R4 | 0.7500 | ** | historic congestion | S1 | 0.7100 | congestion | ||
| R3 | 0.7400 | ** | historic congestion | S2 | 0.7050 | * | congestion | |
| R2 | 0.7280~ | ** | June 2022 high | S3 | 0.7000 | * | congestion | |
| R1 | 0.7200 | ** | break level, 61.8% ret | S4 | 0.6900 | * | congestion |
Asterisk denotes strength of level
09:25 BST - The anticipated test of resistance at 0.7200 is giving way to consolidation, as intraday studies flatten, with prices currently balanced around 0.7180. Daily readings have turned positive and negative weekly stochastics are flattening, suggesting room for a test above 0.7200. But the bearish weekly Tension Indicator should limit any initial break above here in renewed consolidation beneath critical resistance at 0.7280~. Meanwhile, support is at 0.7150. But any tests beneath here should be limited in consolidation above congestion around 0.7100.