Published: 2026-05-28T07:26:21.000Z
Chart GBP/USD Update: Studies turning down
3
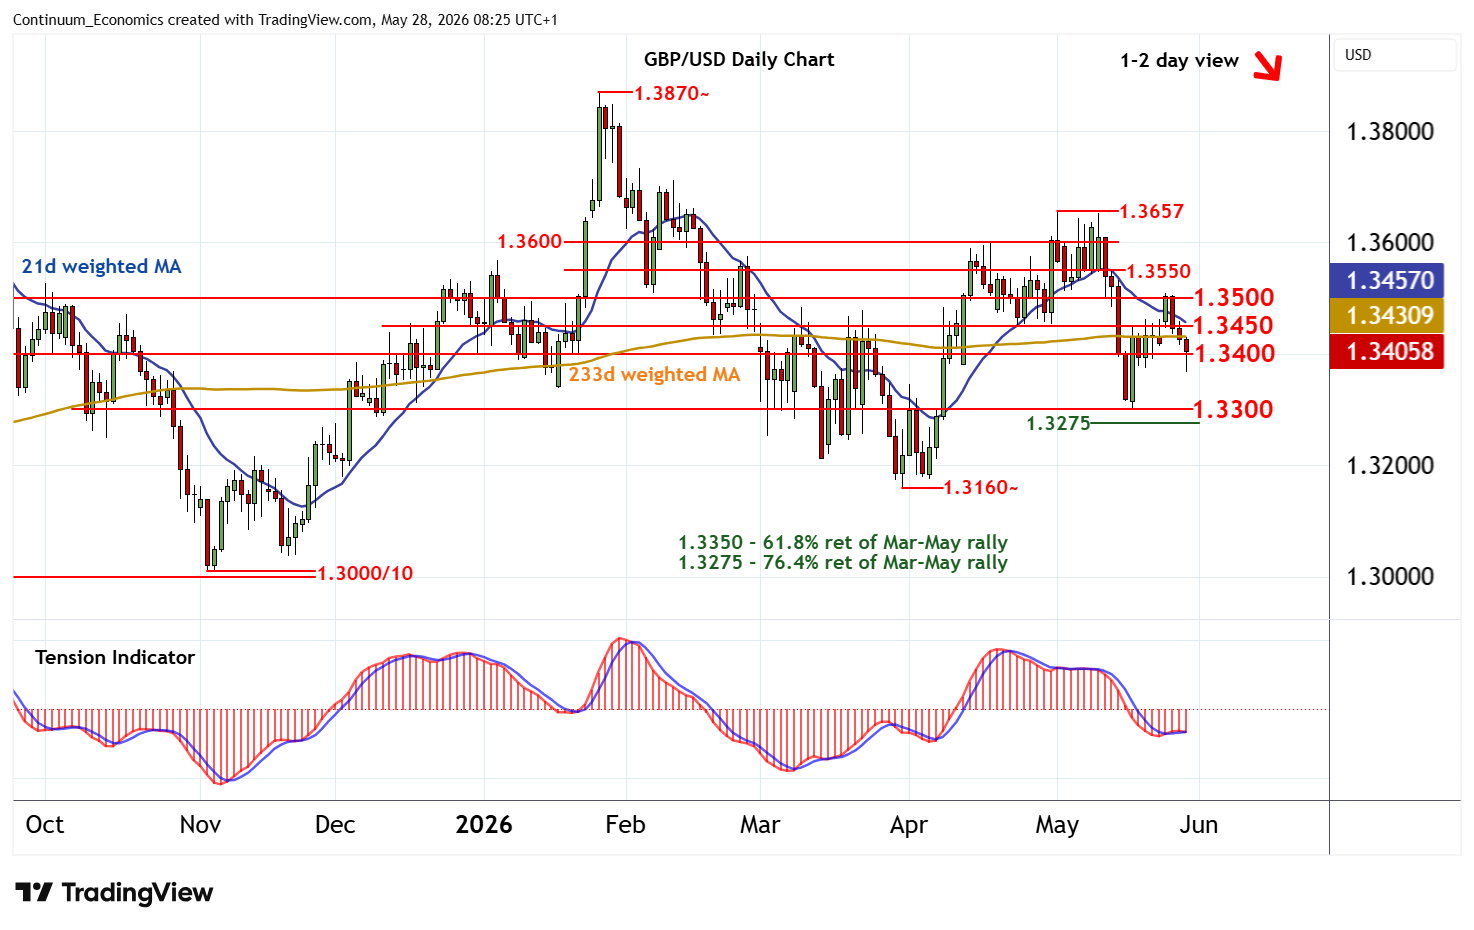
Anticipated losses have tested below 1.3400 to reach 1.3365
| Level | Comment | Level | Comment | |||||
|---|---|---|---|---|---|---|---|---|
| R4 | 1.3600 | * | congestion | S1 | 1.3400 | ** | congestion | |
| R3 | 1.3550 | * | congestion | S2 | 1.3365 | intraday low | ||
| R2 | 1.3500 | ** | congestion | S3 | 1.3300 | ** | congestion | |
| R1 | 1.3450 | break level | S4 | 1.3275 | ** | 76.4% ret of Mar-May rally |
Asterisk denotes strength of level
08:00 BST - Anticipated losses have tested below 1.3400 to reach 1.3365, where unwinding oversold intraday studies are prompting a bounce back above 1.3400. However, daily readings have turned down and broader weekly charts are under pressure, highlighting room for further losses in the coming sessions. A close below congestion support at 1.3400 will add weight to sentiment and open up a test of stronger support at congestion around 1.3300. Meanwhile, resistance is lowered to 1.3450. A close back above here would help to stabilise price action and give way to consolidation beneath congestion resistance at 1.3500.