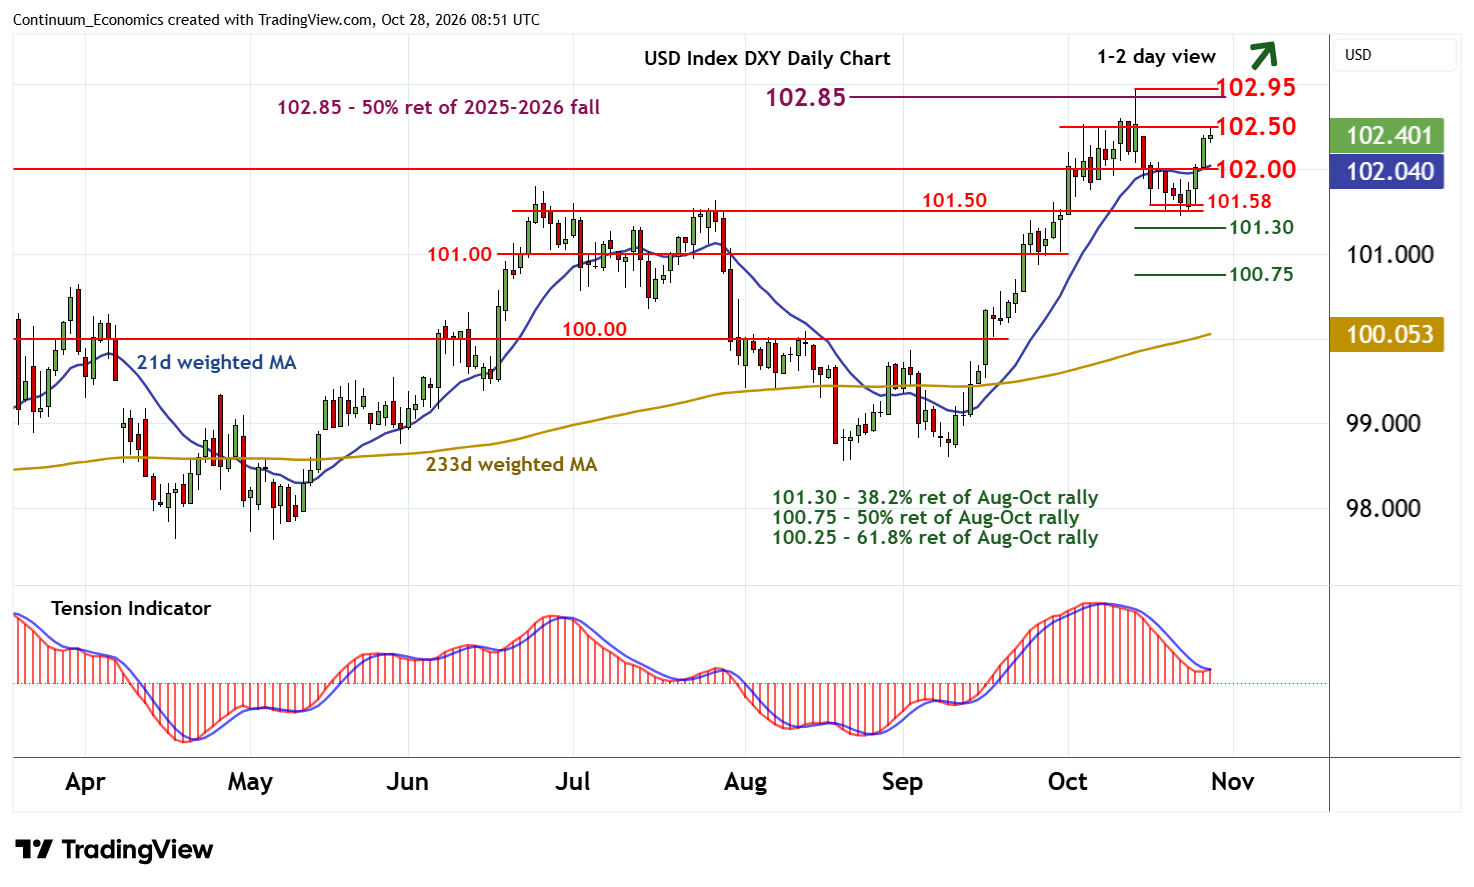
Chart USD Index DXY Update: Near-term studies continue to rise
The anticipated test of congestion resistance at 102.50 is giving way to a minor pullback
| Levels | Imp | Comment | Levels | Imp | Comment | |||
|---|---|---|---|---|---|---|---|---|
| R4 | 103.50 | ** | congestion | S1 | 102.00 | ** | congestion | |
| R3 | 102.95/00 | ** | 14 Oct YTD high; congestion | S2 | 101.50/58 | * | range highs; 16 Oct (w) low | |
| R2 | 102.85 | ** | 50% ret of 2025-2026 fall | S3 | 101.30 | * | 38.2% ret of Aug-Oct rally | |
| R1 | 102.50 | congestion | S4 | 101.00 | ** | congestion |
Asterisk denotes strength of level
08:40 GMT - The anticipated test of congestion resistance at 102.50 is giving way to a minor pullback, as overbought intraday studies unwind, with prices currently trading around 102.35. Daily readings continue to improve, highlighting room for a later break towards critical resistance at the 102.85 Fibonacci retracement and the 102.95 current year high of 14 October. But mixed weekly charts could limit any initial tests in fresh consolidation, before bullish longer-term charts prompt a break and confirm continuation of January gains.
Meanwhile, support remains at congestion around 102.00. A close beneath here, if seen, would help to stabilise price action and prompt fresh range extension above strong support within the 101.50 range highs and the 101.58 weekly low of 16 October.