Published: 2026-10-23T00:24:30.000Z
Chart AUD/USD Update: Consolidating
1
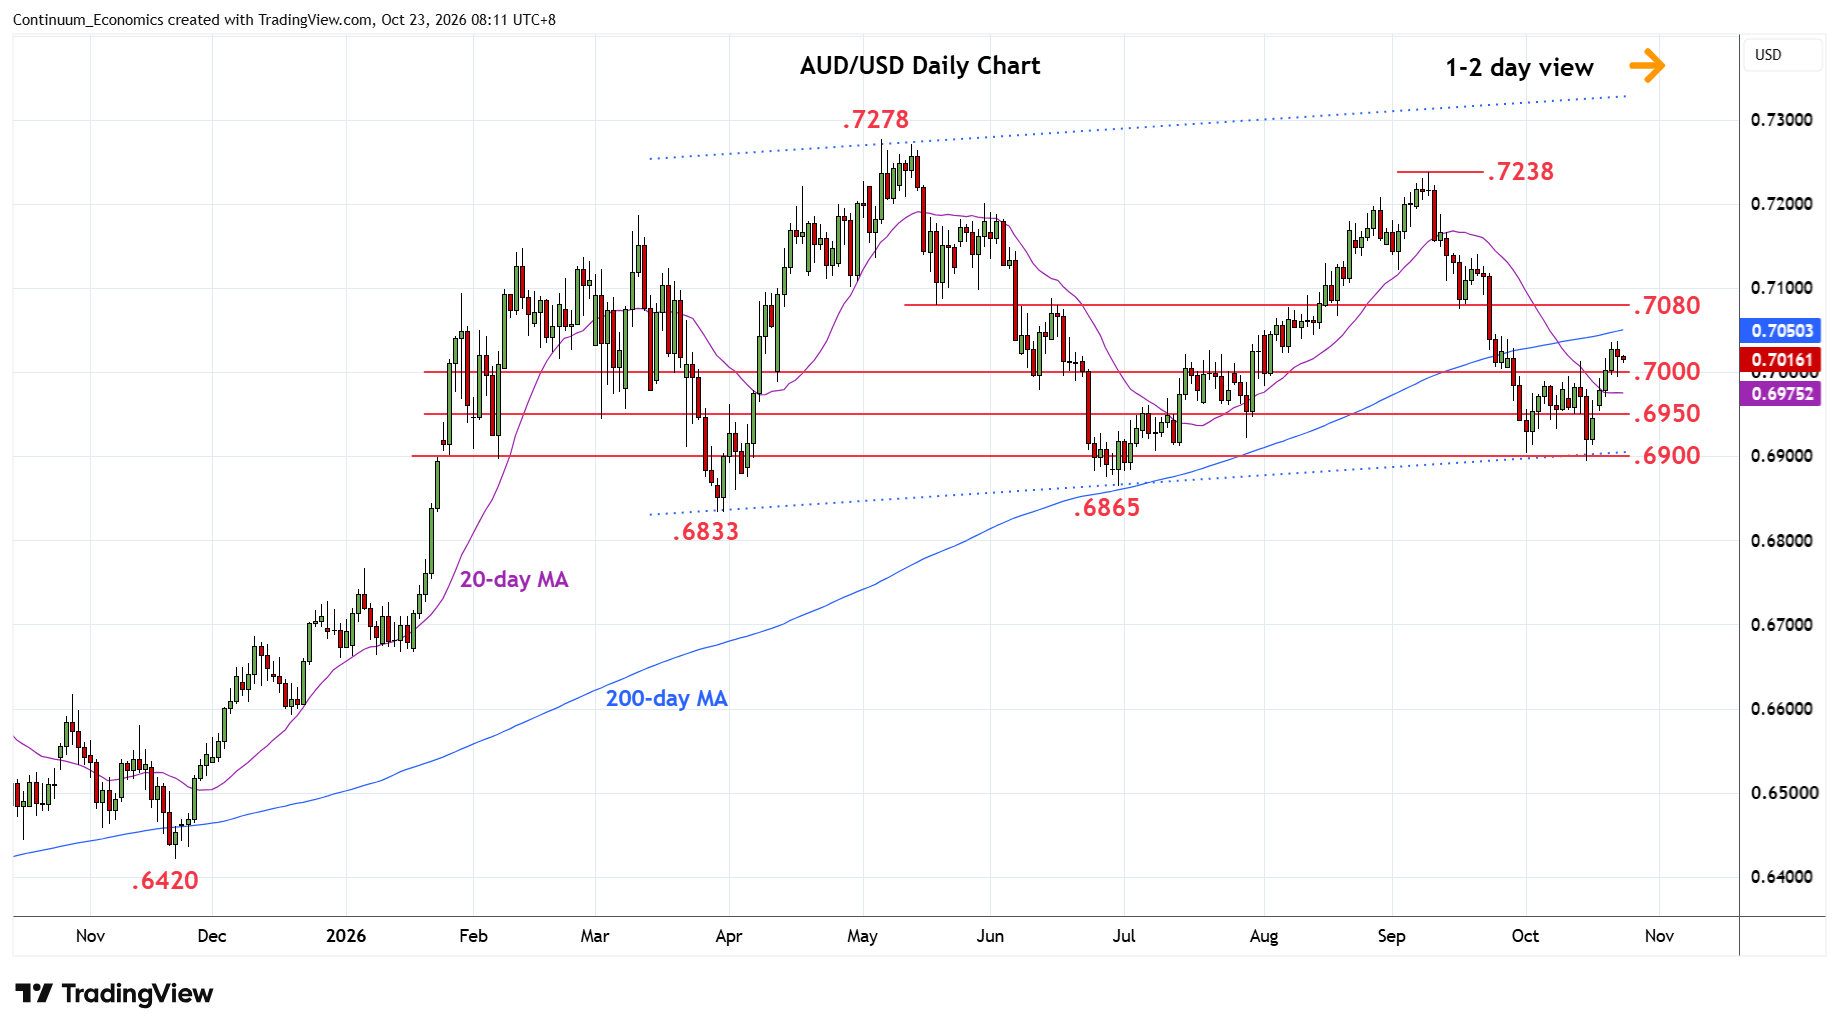
Settled back from the .7036 high as prices consolidate strong gains from the .6900 double bottom and unwind overbought intraday studies
| Levels | Imp | Comment | Levels | Imp | Comment | |||
|---|---|---|---|---|---|---|---|---|
| R4 | 0.7100/05 | * | congestion, 61.8% | S1 | 0.7000 | * | congestion | |
| R3 | 0.7080 | ** | May low, congestion | S2 | 0.6950 | * | congestion | |
| R2 | 0.7065 | * | 50% Sep/Oct fall | S3 | 0.6900 | ** | congestion, channel | |
| R1 | 0.7036 | * | 22 Oct high | S4 | 0.6865 | ** | Jun low |
Asterisk denotes strength of level
00:20 GMT - Settled back from the .7036 high as prices consolidate strong gains from the .6900 double bottom and unwind overbought intraday studies. Daily studies have extend into overbought areas as well and suggest room for corrective pullback. Below the .7000 level will open up room for deeper correction to the .6950 congestion which is expected to underpin. Meanwhile, resistance is at the .7036 high. A later clearance here will see room for further gains to retrace losses from the September high to .7065 Fibonacci level then the strong resistance at .7080/.7100 area.