Published: 2026-10-28T08:29:41.000Z
Chart GBP/USD Update: Extending losses
1
The anticipated break below 1.3300 has reached 1.3275
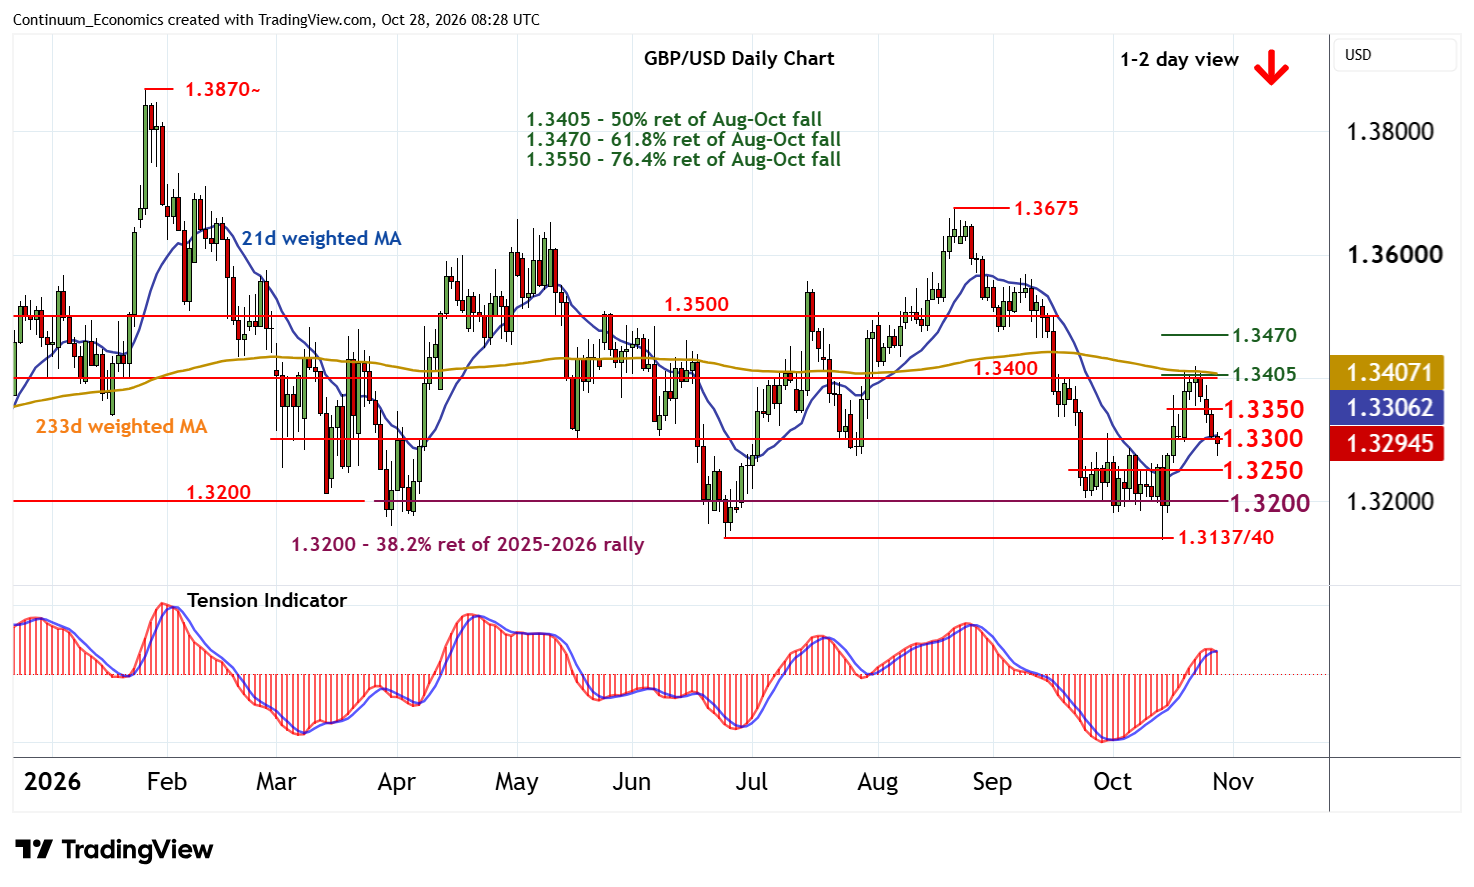
| Level | Comment | Level | Comment | |||||
|---|---|---|---|---|---|---|---|---|
| R4 | 1.3470 | ** | 61.8% ret of Aug-Oct fall | S1 | 1.3250 | * | congestion | |
| R3 | 1.3400/05 | ** | congestion; 50% ret | S2 | 1.3200 | ** | cong, 38.2% ret | |
| R2 | 1.3350 | break level | S3 | 1.3137/40 | ** | 24 Jun - 14 Oct YTD lows | ||
| R1 | 1.3300 | ** | congestion | S4 | 1.3100 | congestion |
Asterisk denotes strength of level
08:10 GMT - The anticipated break below 1.3300 has reached 1.3275, before bouncing into consolidation beneath 1.3300. Intraday studies are negative and daily readings continue to deteriorate, highlighting room for further losses in the coming sessions. A break below 1.3275 will target support at congestion around 1.3250. However, oversold weekly stochastics are unwinding, suggesting any deeper losses should be limited in consolidation/range extension above strong support at 1.3200.
Meanwhile, a close back above congestion resistance at 1.3300 will help to stabilise price action and give way to consolidation beneath 1.3350.