Published: 2026-06-18T00:39:52.000Z
Chart NZD/USD Update: Extend May losses
-
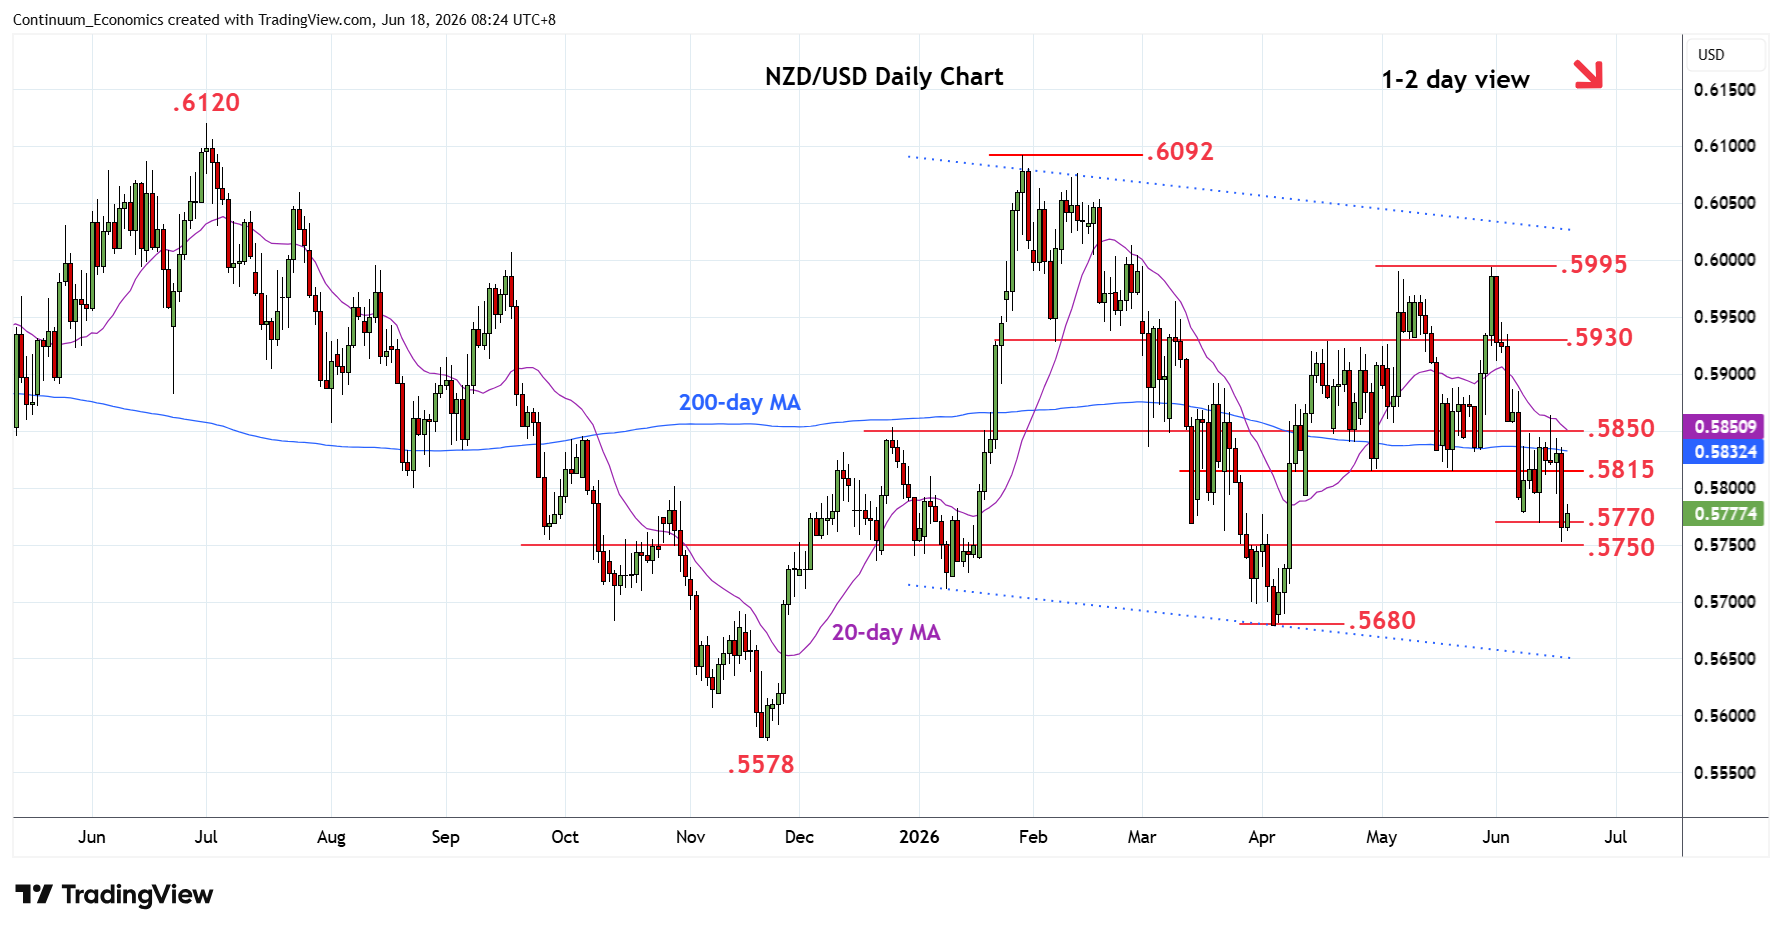
Consolidation above the .5800 level has given way to renewed selling pressure to to reach support at .5750 congestion
| Levels | Imp | Comment | Levels | Imp | Comment | |||
|---|---|---|---|---|---|---|---|---|
| R4 | .5900 | * | congestion | S1 | .5750 | * | congestion | |
| R3 | .5865 | * | 15 Jun high | S2 | .5735 | * | Nov trendline | |
| R2 | .5850 | * | congestion | S3 | .5700 | * | Mar low, congestion | |
| R1 | .5800/15 | ** | congestion, May low | S4 | .5680 | ** | 3 Apr YTD low |
Asterisk denotes strength of level
00:30 GMT - Consolidation above the .5800 level has given way to renewed selling pressure to to reach support at .5750 congestion. Break here will further extend losses from the .5995 May high and see room to .5735 trendline from the November low. Negative daily and weekly studies see risk for break here to open up room for retest of the .5700 level then the .5680, April current year low. Meanwhile, resistance is lowered to .5800/15 area which is expected to cap and sustain rejection from the .5865 Monday's high.