Published: 2026-10-28T01:14:10.000Z
Chart EUR/JPY Update: Under pressure
1
Failed to get a foothold above the 176.20 resistance as prices turned back towards support at 175.42
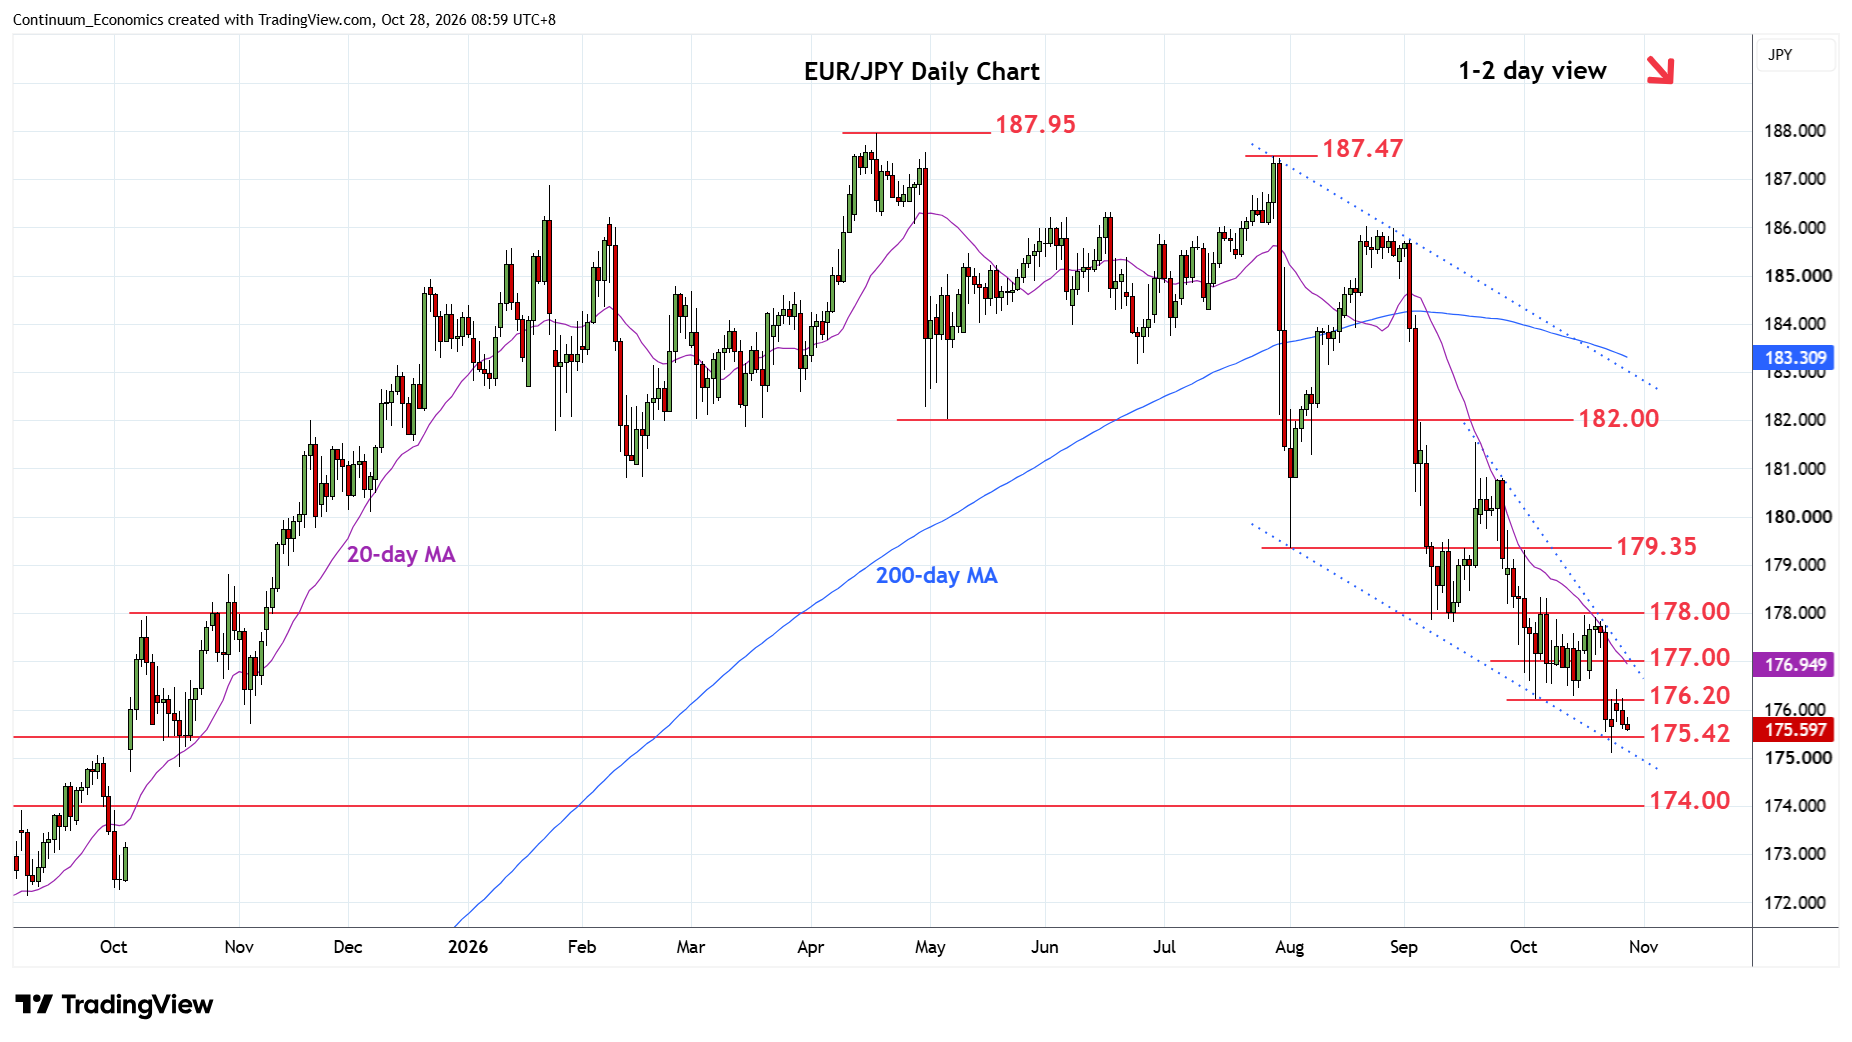
| Levels | Imp | Comment | Levels | Imp | Comment | |||
|---|---|---|---|---|---|---|---|---|
| R4 | 179.35 | ** | Aug low | S1 | 175.42 | * | Jul 2024 yr high | |
| R3 | 178.00 | ** | congestion | S2 | 175.10 | ** | 23 Oct YTD low | |
| R2 | 177.00 | * | congestion | S3 | 174.00 | * | congestion | |
| R1 | 176.20 | * | 5 Oct low | S4 | 173.00 | * | congestion |
Asterisk denotes strength of level
01:10 GMT - Failed to get a foothold above the 176.20 resistance as prices turned back towards support at 175.42. Below this will expose the 175.10 low to retest and threaten break here to extend losses from the April current year high. Break here and the 175.00 level will see room for extension to support at the 174.00/173.00 congestion area. Meanwhile, resistance at 176.20 and extending to the 177.00 congestion and wedge top are expected to cap. Only above these will open up room for stronger bounce to correct losses from the 186.00, August high.