Published: 2026-10-05T06:32:34.000Z
Chart EUR/GBP Update: Retest .8465/.8455 support
7
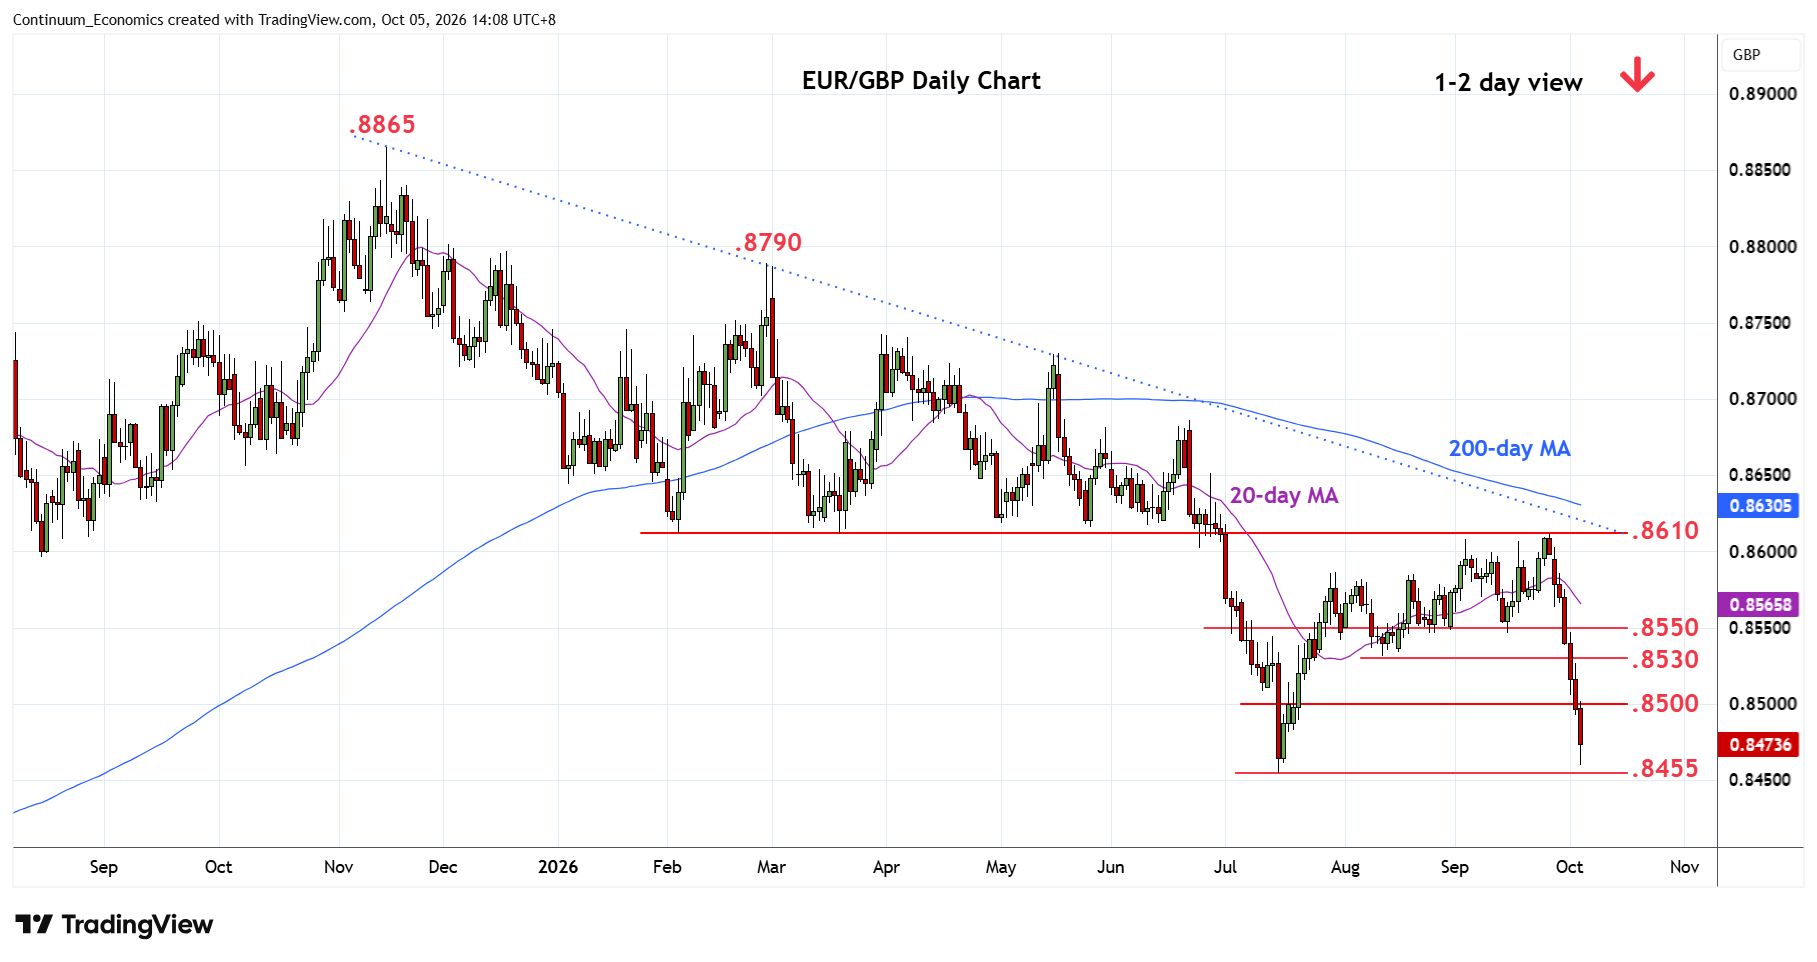
Follow-through below the .8500 level see prices extending sharp losses from the .8610 September swing high
| Level | Comment | Level | Comment | |||||
|---|---|---|---|---|---|---|---|---|
| R4 | 0.8585 | * | Aug high | S1 | 0.8465/55 | ** | 61.8%, 15 Jul YTD low | |
| R3 | 0.8545 | ** | 15 Sep low | S2 | 0.8400 | * | congestion | |
| R2 | 0.8530 | * | Aug low | S3 | 0.8355 | * | May 2025 low | |
| R1 | 0.8500 | * | congestion | S4 | 0.8322 | * | Apr 2025 low |
Asterisk denotes strength of level
06:20 GMT - Follow-through below the .8500 level see prices extending sharp losses from the .8610 September swing high. Losses has since retest the .8465/55, 61.8% Fibonacci level and July current year low. Deep oversold daily studies suggest reaction here likely but a later break here cannot be ruled out to extend losses from the .8865, November 2025 year high. Lower will see room to the .8400 congestion and .8355/.8322, May/April 2025 lows. Meanwhile, resistance is lowered to the .8500 congestion which is expected to cap corrective bounce.