Published: 2026-07-06T01:02:57.000Z
Chart USD/JPY Update: Higher in consolidation
5
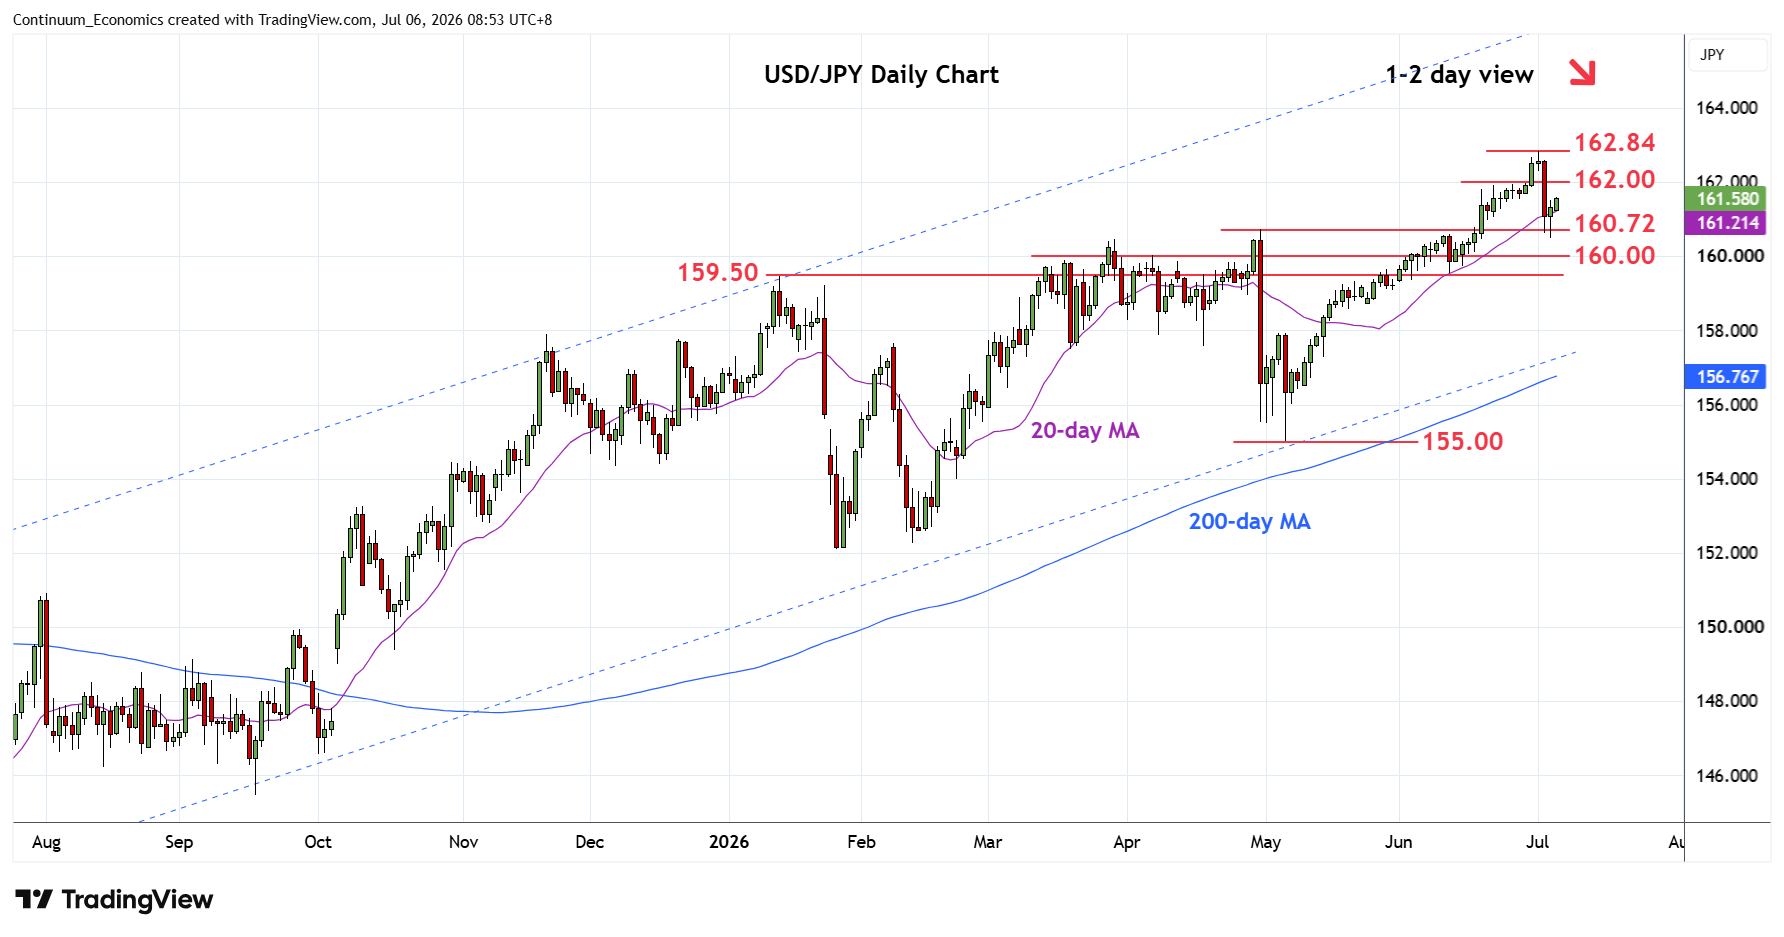
Higher in consolidation above the 161.00 level as prices unwind oversold intraday studies following bounce from 160.50 low
| Levels | Imp | Comment | Levels | Imp | Comment | |||
|---|---|---|---|---|---|---|---|---|
| R4 | 164.00 | * | Dec 1986 high | S1 | 160.72 | ** | Apr high | |
| R3 | 163.00 | * | congestion from Dec 1986 | S2 | 160.00 | * | figure | |
| R2 | 162.84 | ** | 1 Jul multi-year high | S3 | 159.50 | * | congestion | |
| R1 | 162.00 | * | congestion | S4 | 159.00 | * | congestion |
Asterisk denotes strength of level
01:00 GMT - Higher in consolidation above the 161.00 level as prices unwind oversold intraday studies following bounce from 160.50 low. Consolidation is expected to give way to renewed selling pressure later to retest support at the 160.72/50 area. Below here will see room to extend losses from the 162.84 high to support at the 160.00/159.50 area. Meanwhile, resistance is at the 162.00 congestion is expected to cap on bounce attempt and sustain losses from the 162.84 high. Break here, if seen, will extend the underlying bull trend to 163.00/164.00 area.