Published: 2026-10-27T01:40:15.000Z
Chart EUR/USD Update: Under pressure
1
Under pressure as prices extend pullback from resistance the 1.1275 resistance and unwind overbought daily studies
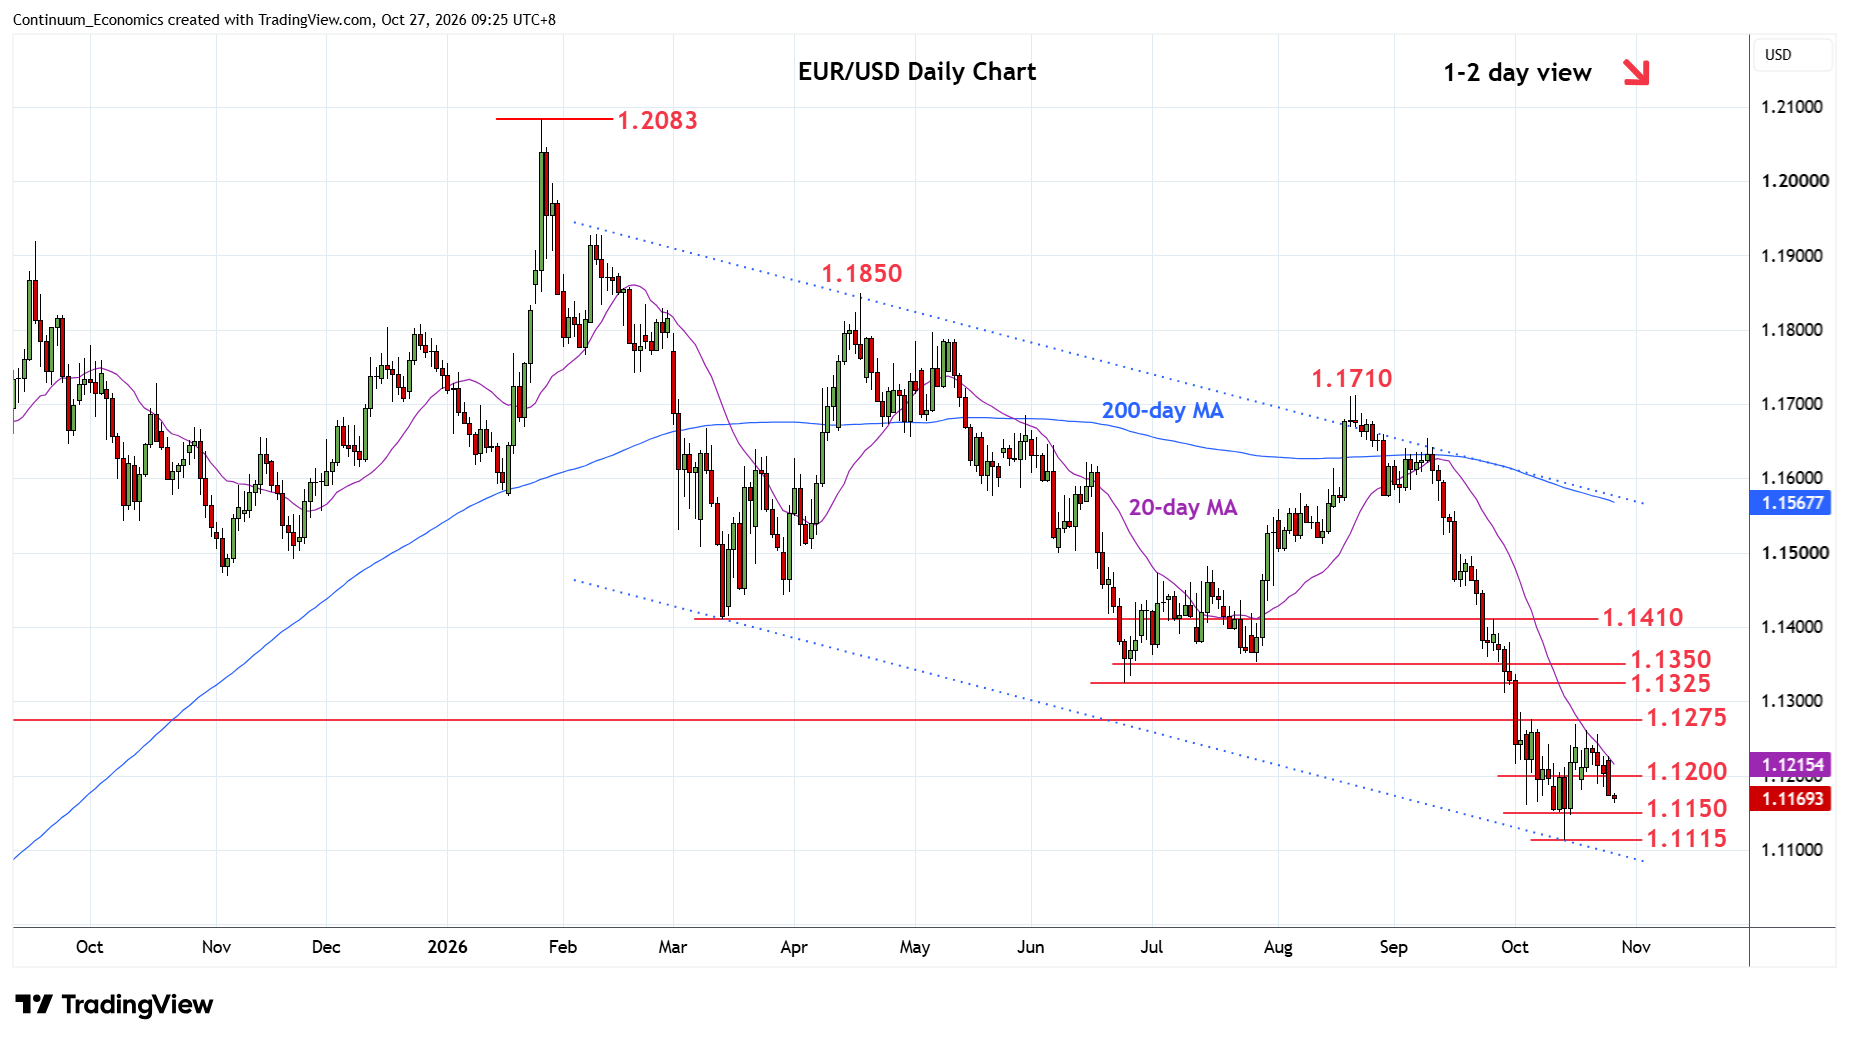
| Levels | Imp | Comment | Levels | Imp | Comment | |||
|---|---|---|---|---|---|---|---|---|
| R4 | 1.1350 | * | congestion | S1 | 1.1150 | * | congestion | |
| R3 | 1.1325 | ** | Jun low | S2 | 1.1115 | ** | 14 Oct YTD low | |
| R2 | 1.1275 | * | 2023 year low | S3 | 1.1100 | * | congestion | |
| R1 | 1.1200 | * | congestion | S4 | 1.1065 | * | May 2025 low |
Asterisk denotes strength of level
01:30 GMT - Under pressure as prices extend pullback from resistance the 1.1275 resistance and unwind overbought daily studies. Break of the 1.1200 level see room to support at the 1.1150 congestion. Below here will return focus to the 1.1115 low and the 1.1100 congestion where reaction can be expected. Meanwhile, resistance is lowered to the 1.1200 congestion which extend to the 1.1275, 2023 year low. Would need to clear this to open up room for stronger recovery to retrace losses from the August high to strong resistance at the 1.1325/50 June/July lows.