Published: 2026-06-10T12:11:05.000Z
Chart USD/ZAR Update: Higher in range - daily studies rising
1
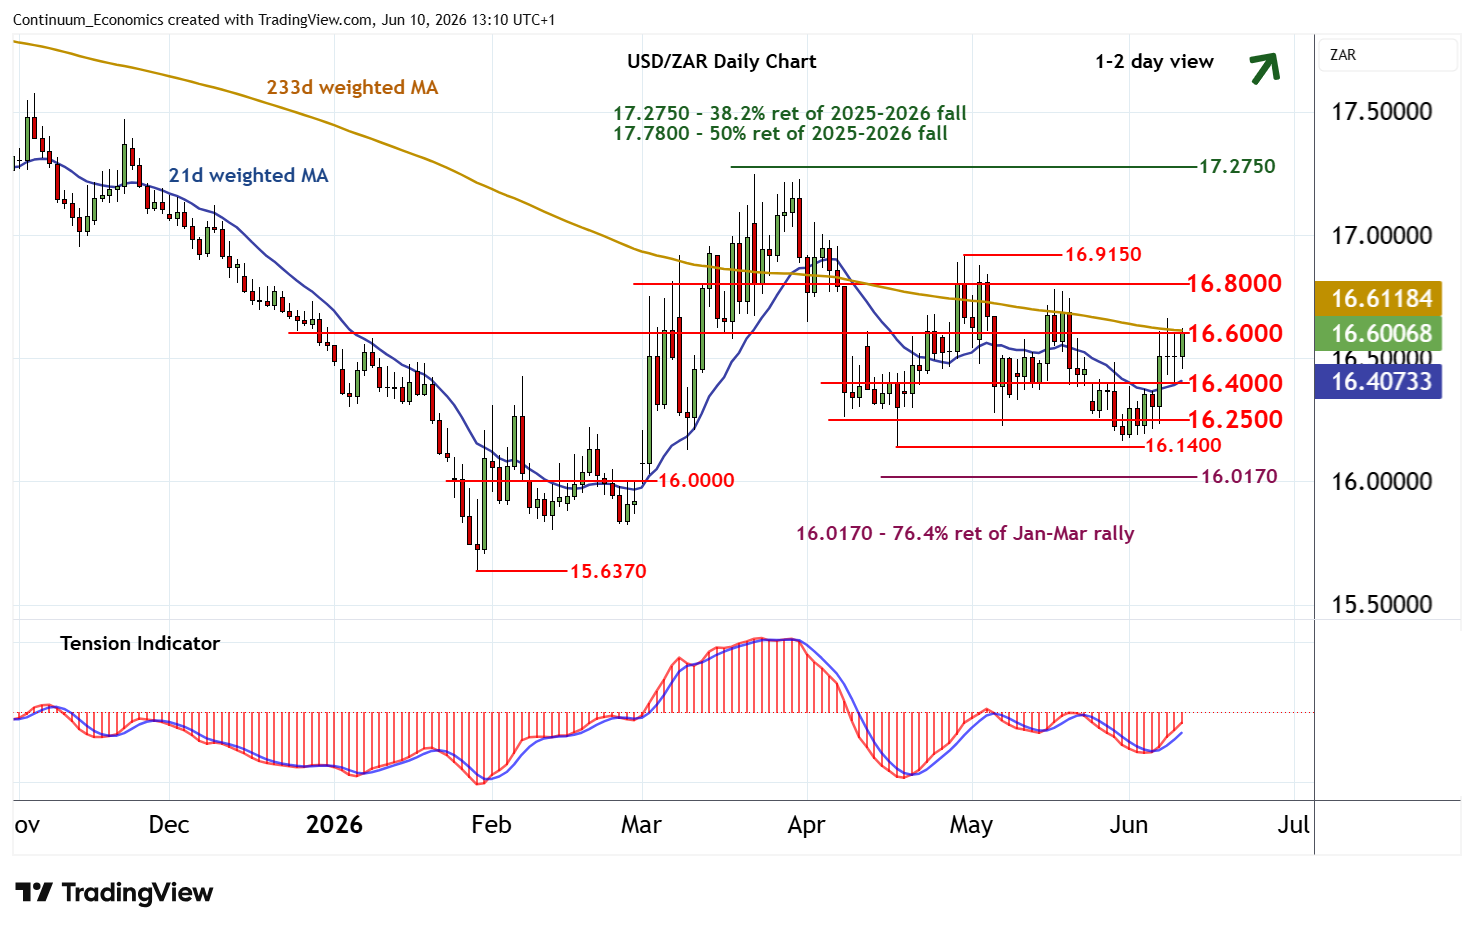
Little change, as prices extend cautious trade within the 16.4000 - 16.6000 range
| Level | Comment | Level | Comment | |||||
|---|---|---|---|---|---|---|---|---|
| R4 | 16.9150 | ** | 30 Apr (w) high | S1 | 16.4000 | congestion | ||
| R3 | 16.8000 | * | congestion | S2 | 16.2500 | * | congestion | |
| R2 | 16.6630 | 8 Jun high | S3 | 16.1400 | ** | 17 Apr (m) low | ||
| R1 | 16.6000 | * | congestion | S4 | 16.0170 | ** | 76.4% ret of Jan-Mar rally |
Asterisk denotes strength of level
13:00 BST - Little change, as prices extend cautious trade within the 16.4000 - 16.6000 range. Both intraday and daily studies are rising, highlighting room for a test above congestion resistance at 16.6000. But already overbought daily stochastics and mixed weekly charts should limit initial scope in renewed consolidation beneath further congestion around 16.8000. Meanwhile, support remains at congestion around 16.4000. A break beneath here, if seen, should be limited in fresh consolidation above 16.2500.