Published: 2026-10-06T05:05:01.000Z
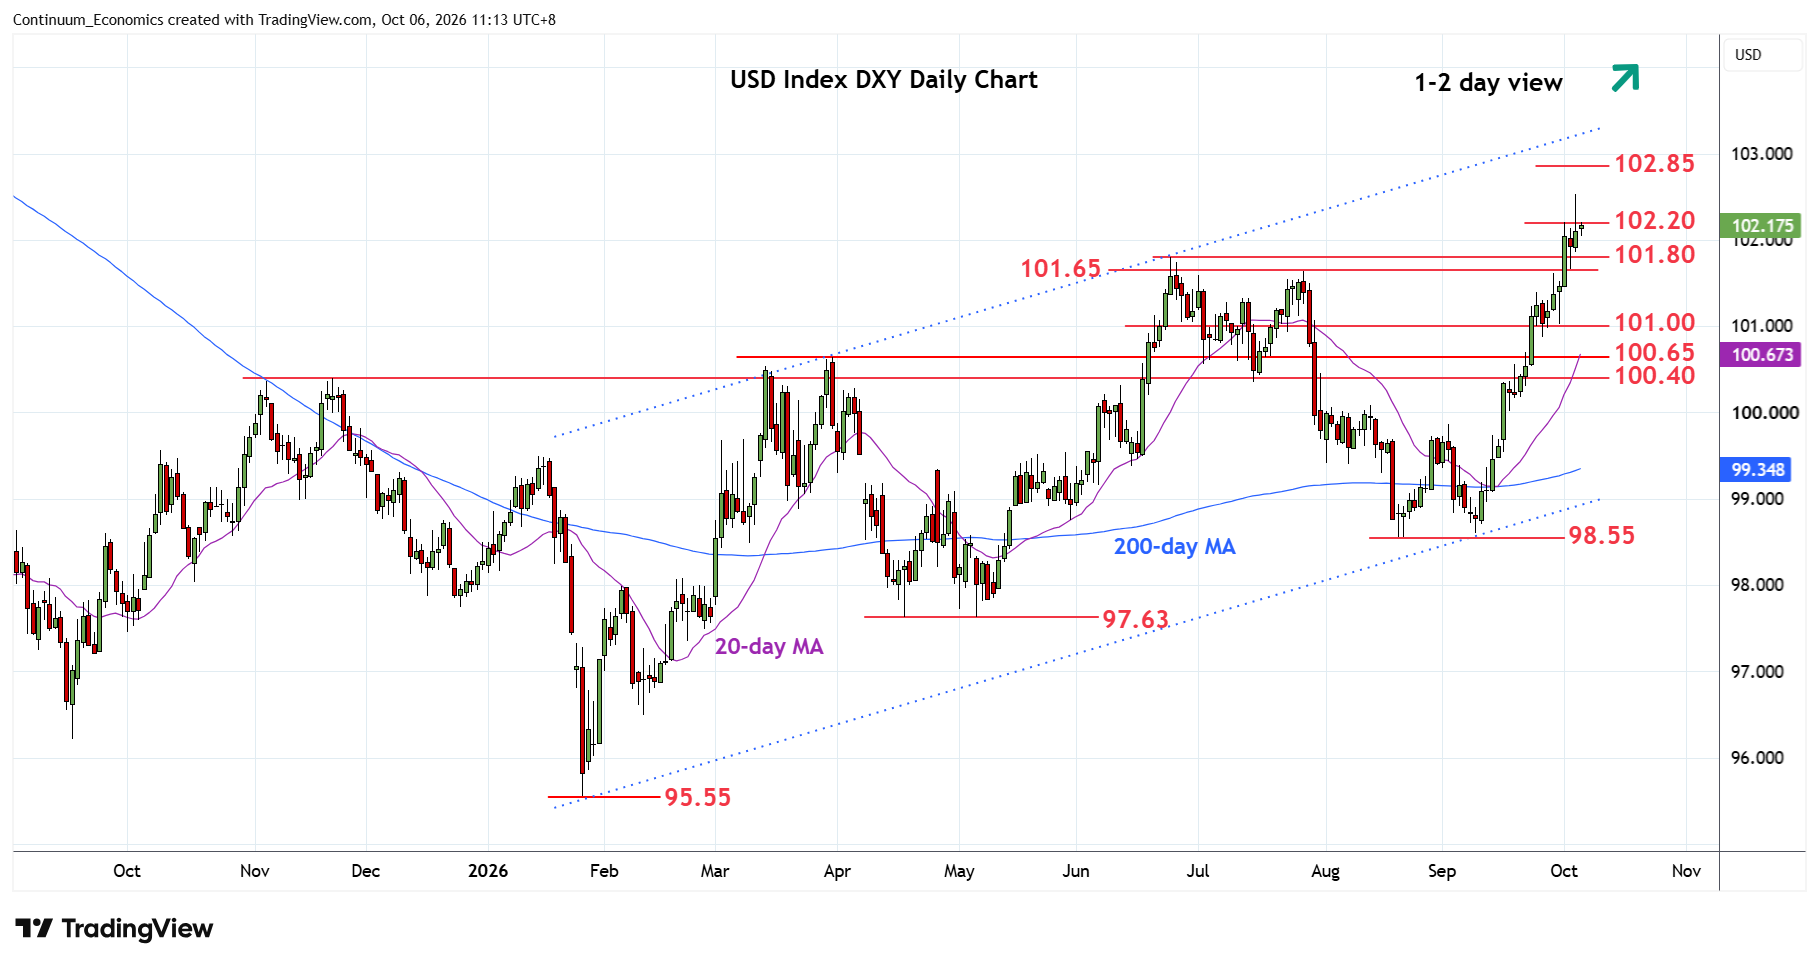
Chart USD Index DXY Update: Consolidating at 102.53 fresh year high
2
Settled back in consolidation following break to fresh year high at 102.53
| Levels | Imp | Comment | Levels | Imp | Comment | |||
|---|---|---|---|---|---|---|---|---|
| R4 | 103.20 | ** | Mar 2025 low | S1 | 101.80 | ** | Jun high | |
| R3 | 103.00 | * | congestion | S2 | 101.65 | * | Jul high | |
| R2 | 102.85 | * | 50% 2025/2026 fall | S3 | 101.00 | * | congestion | |
| R1 | 102.53 | * | 5 Oct YTD high | S4 | 100.65 | ** | Mar high |
Asterisk denotes strength of level
03:20 GMT - Settled back in consolidation following break to fresh year high at 102.53. Bullish gains from the 98.55 August low keep focus on the upside and higher will see room towards 50% Fibonacci retracement at 102.85 then the 103.20, March 2025 low. Overbought daily studies caution corrective pullback with support starting at the 101.80/101.65, June/July highs. Would take break here to fade the upside pressure and see room for pullback to retrace gains from the August low to 101.00 congestion then strong support at 100.65/100.40, March and November 2025 highs.