Published: 2026-09-03T08:34:37.000Z
Chart USD Index DXY Update: Leaning lower
2
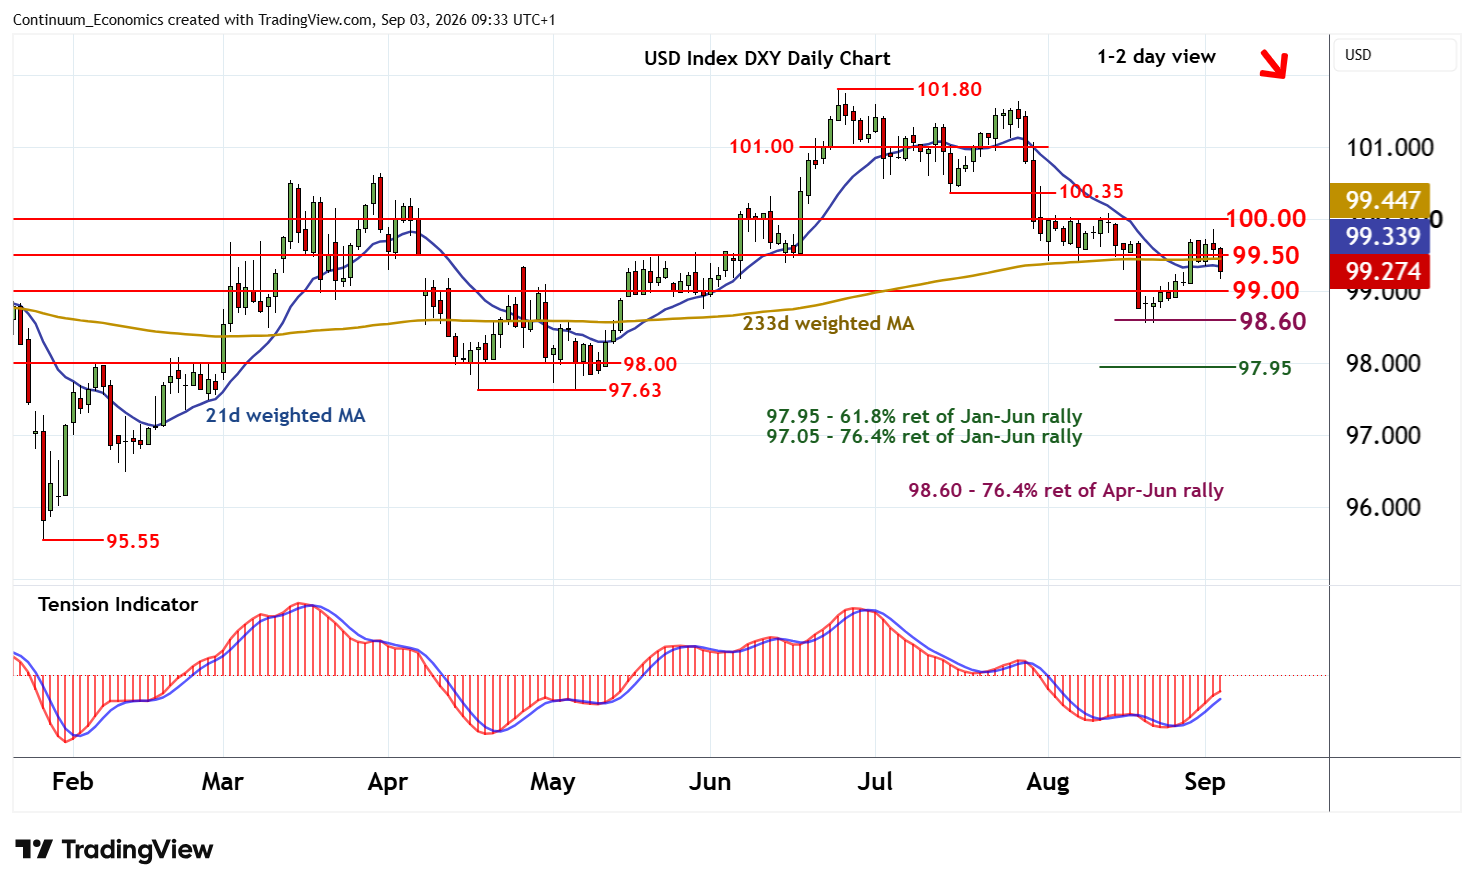
Choppy trade above 99.50 has given way to a break lower
| Levels | Imp | Comment | Levels | Imp | Comment | |||
|---|---|---|---|---|---|---|---|---|
| R4 | 101.00 | ** | congestion | S1 | 99.00 | ** | congestion | |
| R3 | 100.35 | * | 15 Jul (w) low | S2 | 98.60 | ** | 76.4% ret of Apr-Jun rally | |
| R2 | 100.00 | ** | congestion | S3 | 97.95/00 | ** | 61.8% ret; congestion | |
| R1 | 99.50 | ** | congestion | S4 | 97.63 | ** | 17 Apr - 6 May (m) lows |
Asterisk denotes strength of level
08:55 BST - Choppy trade above 99.50 has given way to a break lower, as intraday studies turn down, with prices reaching 99.15~ before bouncing back to 99.25. Overbought daily stochastics are turning down, highlighting room for continuation down to congestion support at 99.00. But the positive daily Tension Indicator is expected to limit any initial break in fresh consolidation above the 98.60 Fibonacci retracement, before mixed/negative weekly charts extend losses still further.
Meanwhile, a close back above 99.50, if seen, will help to stabilise price action and prompt consolidation beneath further congestion around 100.00.