Published: 2026-07-15T06:19:06.000Z
Chart USD Index DXY Update: Leaning lower in consolidation
4
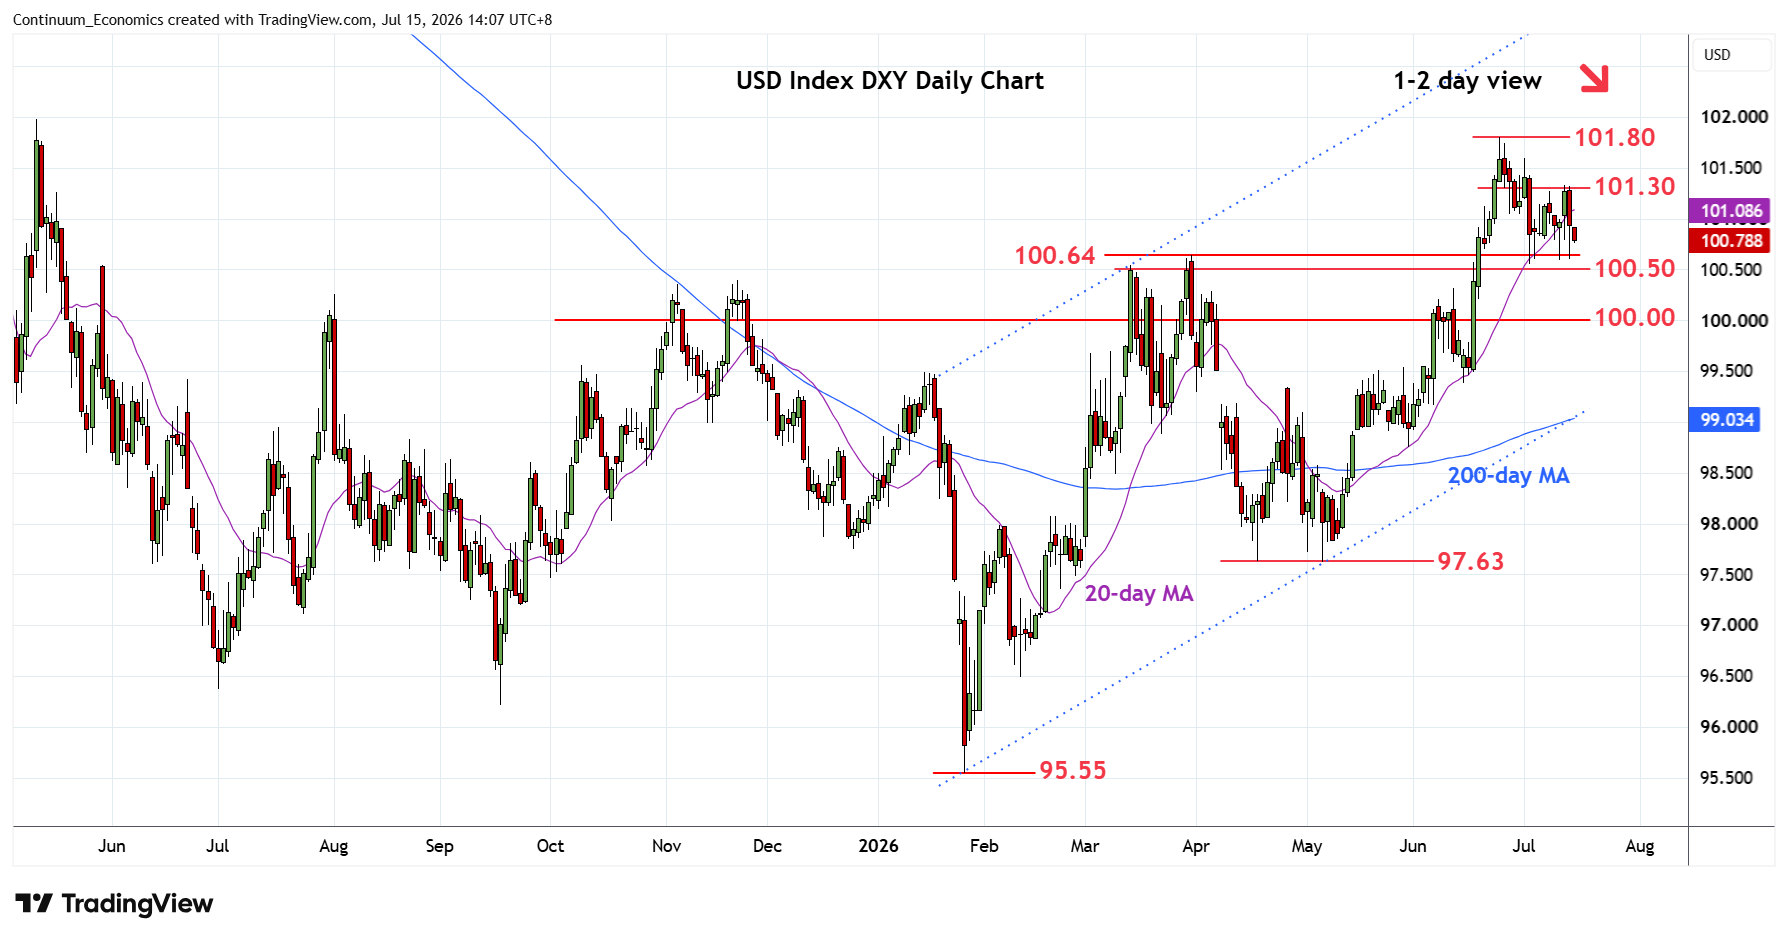
Leaning lower in consolidation following rejection from the 101.30 congestion
| Levels | Imp | Comment | Levels | Imp | Comment | |||
|---|---|---|---|---|---|---|---|---|
| R4 | 102.50 | * | congestion | S1 | 100.64 | ** | Mar high | |
| R3 | 102.00 | ** | congestion | S2 | 100.50 | * | congestion | |
| R2 | 101.80 | ** | 24 Jun YTD high | S3 | 100.20 | * | 38.2% Apr/Jun rally | |
| R1 | 101.30 | * | congestion | S4 | 100.00 | * | congestion |
Asterisk denotes strength of level
06:15 GMT - Leaning lower in consolidation following rejection from the 101.30 congestion. Below the 101.00 level threatens pullback to strong support at the 100.64/100.50 area. Daily and weekly studies have turned lower from overbought areas and suggest scope for break here to extend the late-June losses towards the 100.20, 38.2% Fibonacci retracement, then the 100.00 level. Meanwhile, resistance is lowered to the 101.00/30 congestion area which should cap corrective bounce and sustain losses from the 101.80, June current year high.