Published: 2026-11-13T00:53:28.000Z
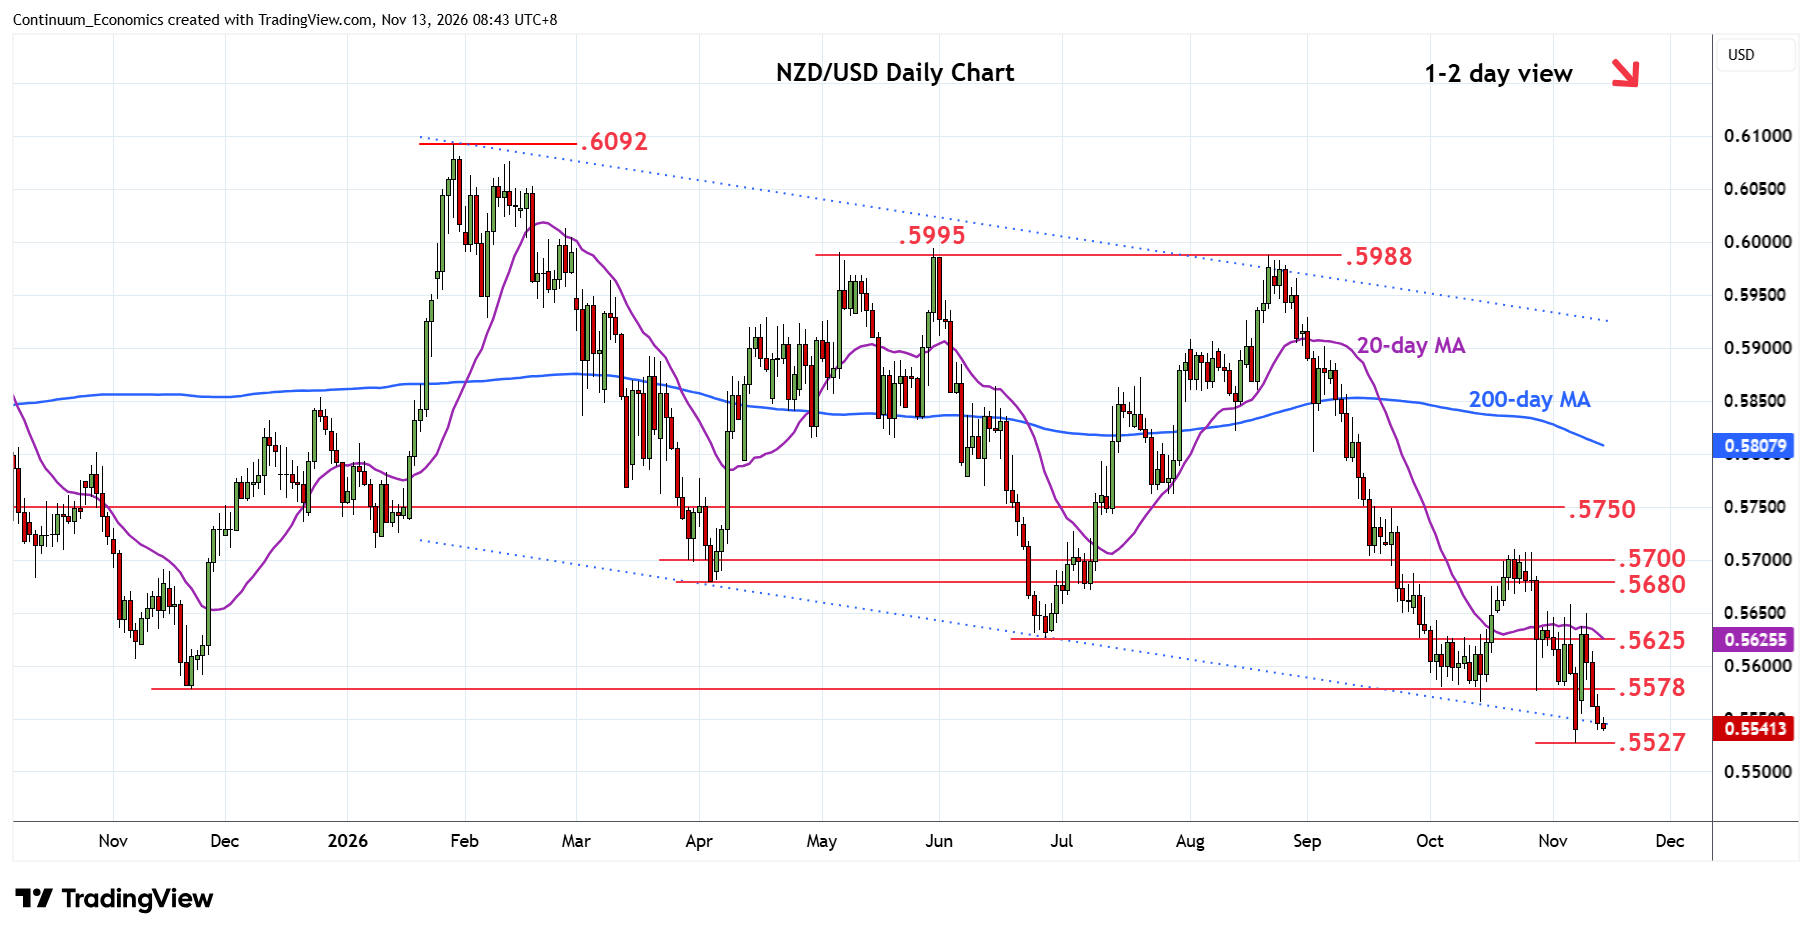
Chart NZD/USD Update: Under pressure, .5527 low at risk
1
Break of the .5578 support see prices edging to retest the .5527 current year low of last Friday
| Levels | Imp | Comment | Levels | Imp | Comment | |||
|---|---|---|---|---|---|---|---|---|
| R4 | .5700/10 | ** | congestion, Oct high | S1 | .5527 | ** | 6 Nov YTD low | |
| R3 | .5680 | * | Apr low | S2 | .5512 | * | Oct 2022 year low | |
| R2 | .5625/50 | ** | Jun low, congestion | S3 | .5485 | ** | Apr 2025 year low | |
| R1 | .5578 | * | Nov 2025 low | S4 | .5470 | ** | Mar 2020 year low |
Asterisk denotes strength of level
00:45 GMT - Break of the .5578 support see prices edging to retest the .5527 current year low of last Friday. Bearish daily and weekly studies threatens break here to extend the broader losses from the July 2025 year high to the strong support area at .5512/.5470, 2025/2020 year lows, and where reaction can be expected. Meanwhile, resistance starts at the November 2025 low at .5578. Above here and the .5600 level will see room for strong resistance at .5625, June low. Would need to regain this to fade the downside pressure and see room for stronger bounce to retrace losses from August swing high.