Published: 2026-07-29T00:51:35.000Z
Chart USD/JPY Update: Pressure building on 164.00 resistance
3
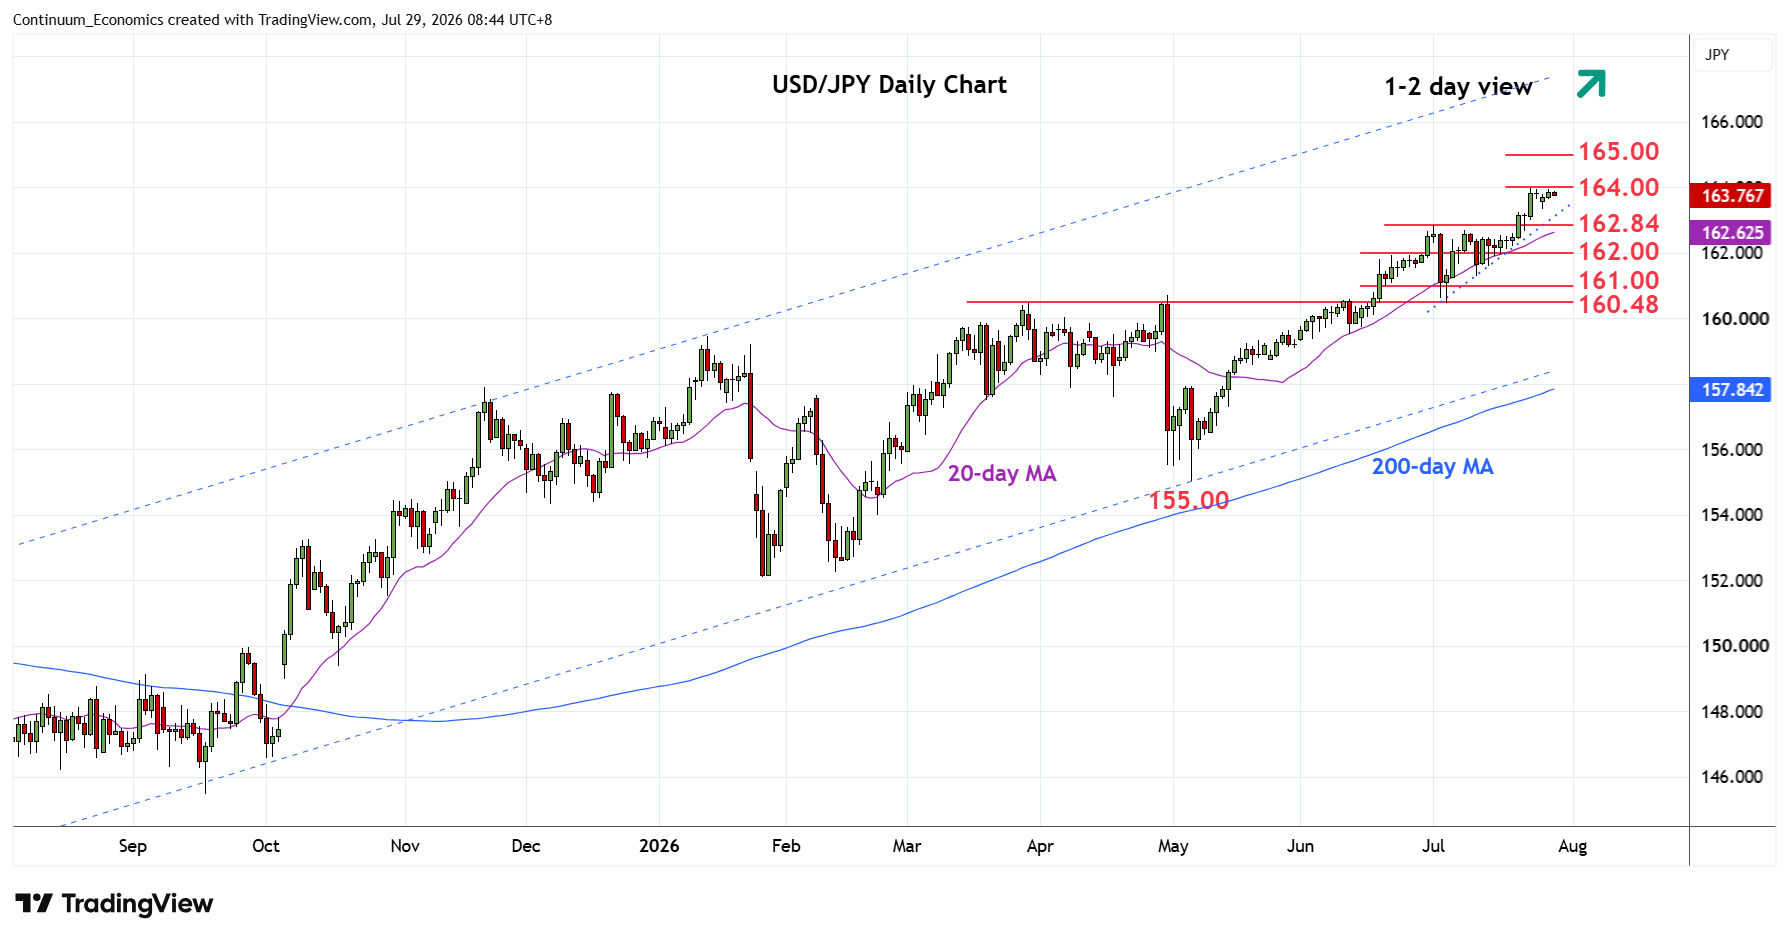
Extending consolidation below the 164.00 December 1986 high but pressure remains on the upside
| Levels | Imp | Comment | Levels | Imp | Comment | |||
|---|---|---|---|---|---|---|---|---|
| R4 | 165.00 | * | figure | S1 | 163.24 | * | 21 Jul high | |
| R3 | 164.95 | ** | Nov 1986 high | S2 | 162.84 | * | 1 Jul high | |
| R2 | 164.55 | * | 24 Nov 1986 high | S3 | 162.50/00 | ** | congestion | |
| R1 | 164.00 | ** | Dec 1986 high | S4 | 161.28/00 | * | 10 Jul low, congestion |
Asterisk denotes strength of level
00:45 GMT - Extending consolidation below the 164.00 December 1986 high but pressure remains on the upside. The small ascending triangle suggest scope for break to extend strong gains from the April low. Higher, will see scope for extension to retest 164.55/164.95 highs of November 1986 and the 165.00 figure. Meanwhile, support remains at the 163.24 and 162.84 recent July highs which should underpin. Would take break of these to ease the upside pressure and see room for consolidation to support at 162.00 and 161.28/00 area.