Published: 2026-09-04T00:29:57.000Z
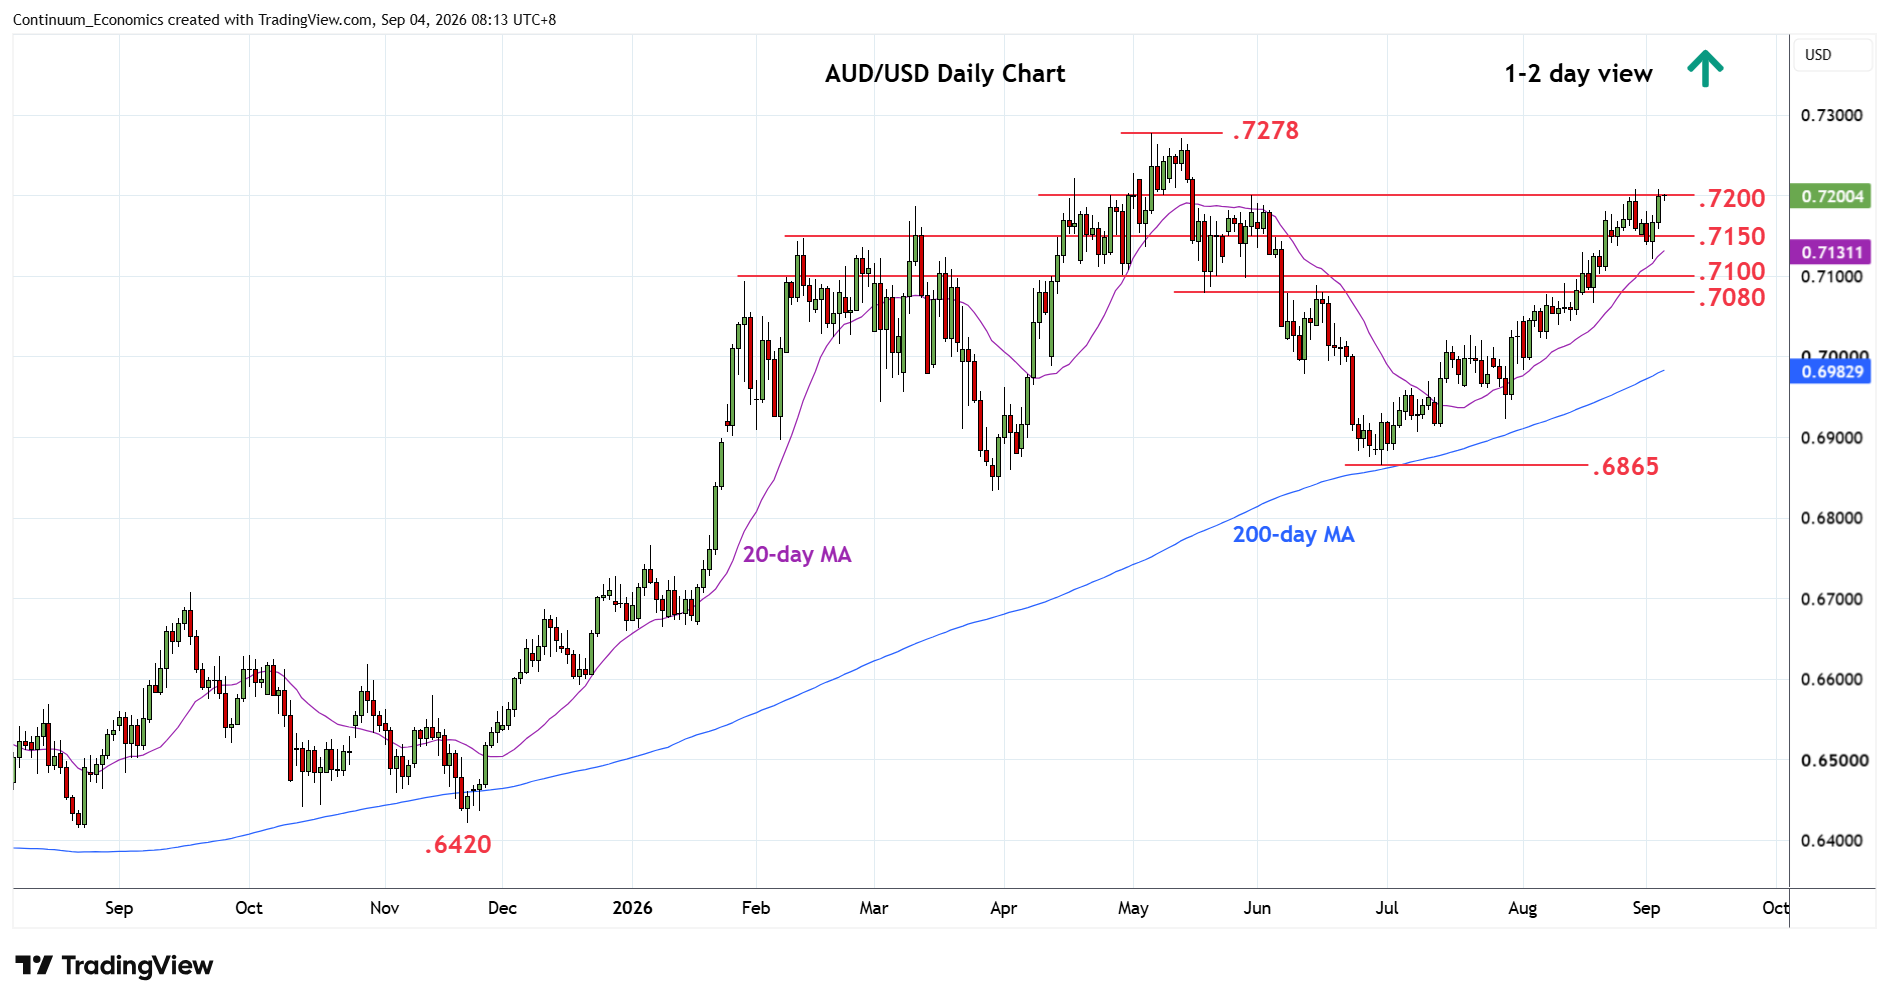
Chart AUD/USD Update: Pressuring .7200/08 resistance
3
Turned up from the .7121 low has seen sharp bounce to retest resistance at the .7200/08 high
| Levels | Imp | Comment | Levels | Imp | Comment | |||
|---|---|---|---|---|---|---|---|---|
| R4 | 0.7400 | * | congestion | S1 | 0.7150 | * | congestion | |
| R3 | 0.7300 | * | congestion | S2 | 0.7121 | ** | 2 Sep low | |
| R2 | 0.7278 | ** | 6 May YTD high | S3 | 0.7100 | * | congestion | |
| R1 | 0.7200/08 | * | congestion, 28 Aug high | S4 | 0.7080 | ** | May low |
Asterisk denotes strength of level
00:20 GMT - Turned up from the .7121 low has seen sharp bounce to retest resistance at the .7200/08 high. Daily studies have turned positive and suggest scope for break here to and return focus to the .7278, May current year high. Would expect reaction on retest of the latter but bullish gains from the low of April 2025 suggest scope for break to retrace losses from the 2021 year high. Meanwhile, support remains at the .7150 congestion which extend to the mid-week .7121 low. This area now expected to underpin and sustain bullish gains from the late-June low.