Chart USD Index DXY Update: Edging higher
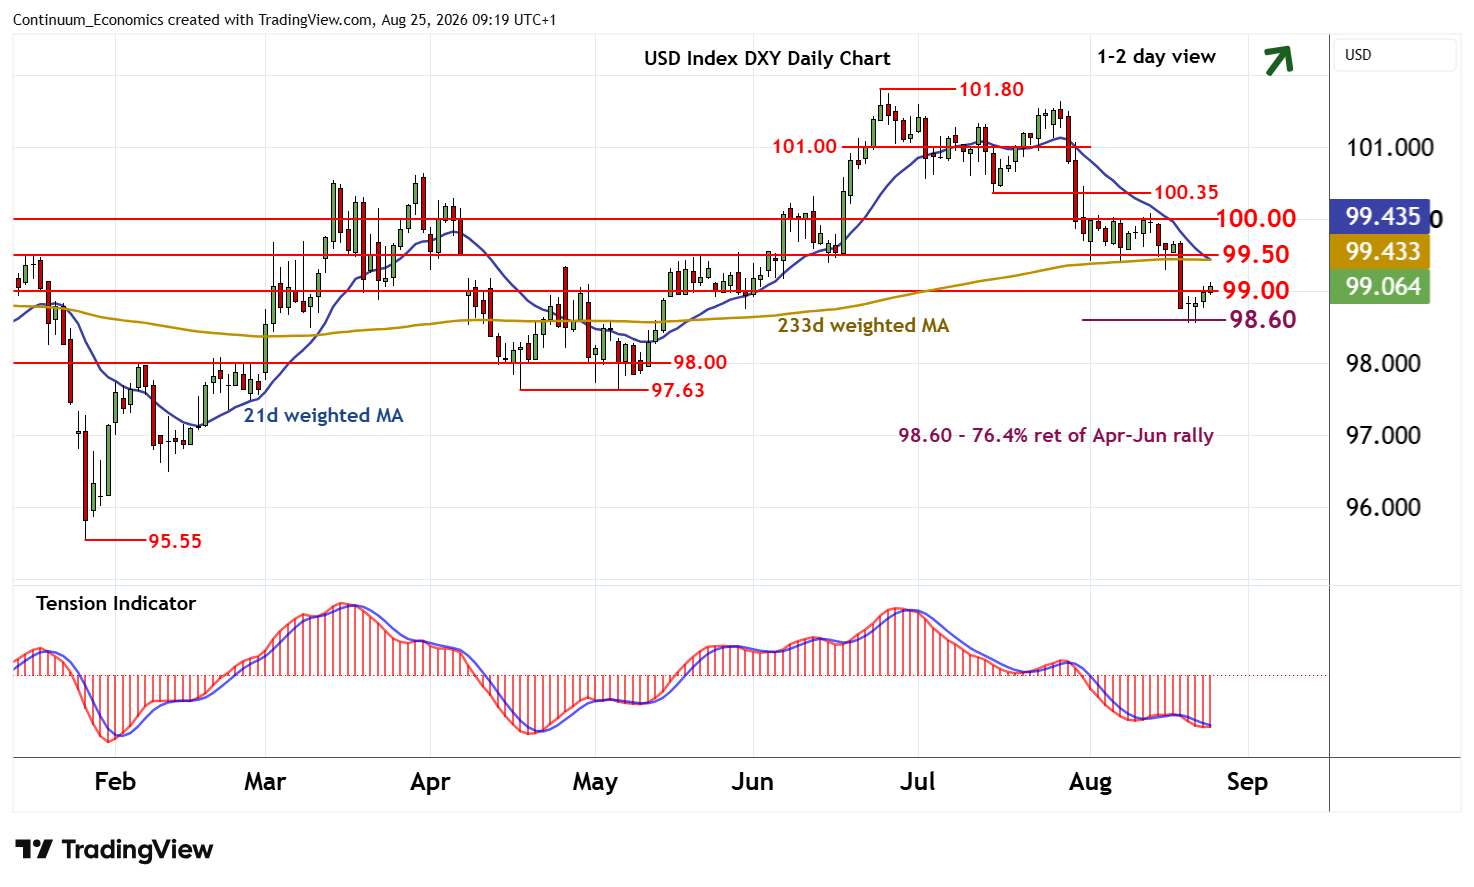
Cautious trade around 99.00 is giving way to the anticipated break
| Levels | Imp | Comment | Levels | Imp | Comment | |||
|---|---|---|---|---|---|---|---|---|
| R4 | 101.00 | ** | congestion | S1 | 99.00 | ** | congestion | |
| R3 | 100.35 | * | 15 Jul (w) low | S2 | 98.60 | ** | 76.4% ret of Apr-Jun rally | |
| R2 | 100.00 | ** | congestion | S3 | 98.00 | ** | congestion | |
| R1 | 99.50 | ** | congestion | S4 | 97.63 | ** | Apr-May lows |
Asterisk denotes strength of level
09:10 BST - Cautious trade around 99.00 is giving way to the anticipated break, with prices currently trading around 99.10. Oversold daily stochastics are unwinding and the flat daily Tension Indicator is showing early signs of improvement, suggesting room for further gains in the coming sessions. Resistance is at congestion around 99.50. But negative weekly charts should limit any initial tests in renewed selling interest.
Following cautious/corrective trade, fresh losses are looked for. However, a close back below 99.00 will turn sentiment neutral. A further close below the 98.60 Fibonacci retracement is needed to turn sentiment negative once again and extend late-June losses towards congestion around 98.00.