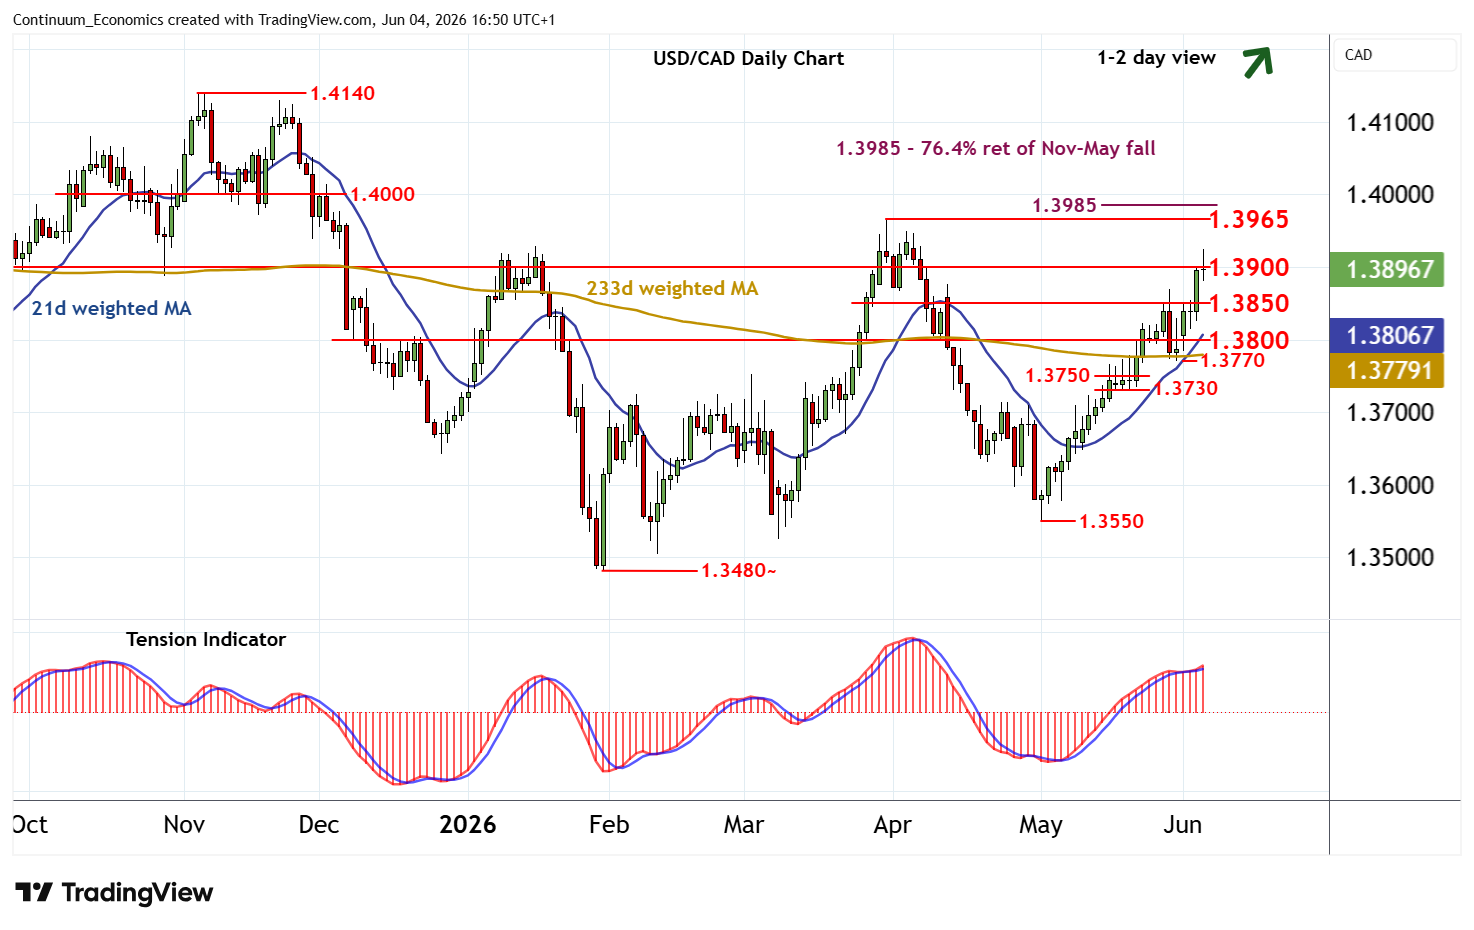
Chart USD/CAD Update: Extending May gains in CAD-driven trade
The anticipated test of congestion resistance at 1.3900 has reached 1.3925
| Levels | Imp | Comment | Levels | Imp | Comment | |||
|---|---|---|---|---|---|---|---|---|
| R4 | 1.4000 | ** | break level | S1 | 1.3850 | congestion | ||
| R3 | 1.3985 | ** | 76.4% ret of Nov-May fall | S2 | 1.3800 | * | congestion | |
| R2 | 1.3965 | ** | 31 Mar YTD high | S3 | 1.3770 | ** | 29 May (w) low | |
| R1 | 1.3900 | ** | congestion | S4 | 1.3750 | congestion |
Asterisk denotes strength of level
16:30 BST - The anticipated test of congestion resistance at 1.3900 has reached 1.3925, where deteriorating intraday studies are prompting renewed selling interest and a break back below 1.3900. Daily readings continue to rise and broader weekly charts are positive, highlighting room for further (CAD-driven) gains in the coming sessions. A close above 1.3900 will improve sentiment and extend May gains towards strong resistance at the 1.3965 current year high of 31 May and the 1.3985 Fibonacci retracement. However, by-then overbought daily stochastics could prompt profit-taking towards here. Meanwhile, support remains at congestion around 1.3850. A close beneath here, if seen, will help to stabilise sentiment and prompt consolidation above further congestion around 1.3800.