Published: 2026-05-25T07:16:36.000Z
Chart GBP/JPY Update: Pressuring 214.00/214.40 resistance
3
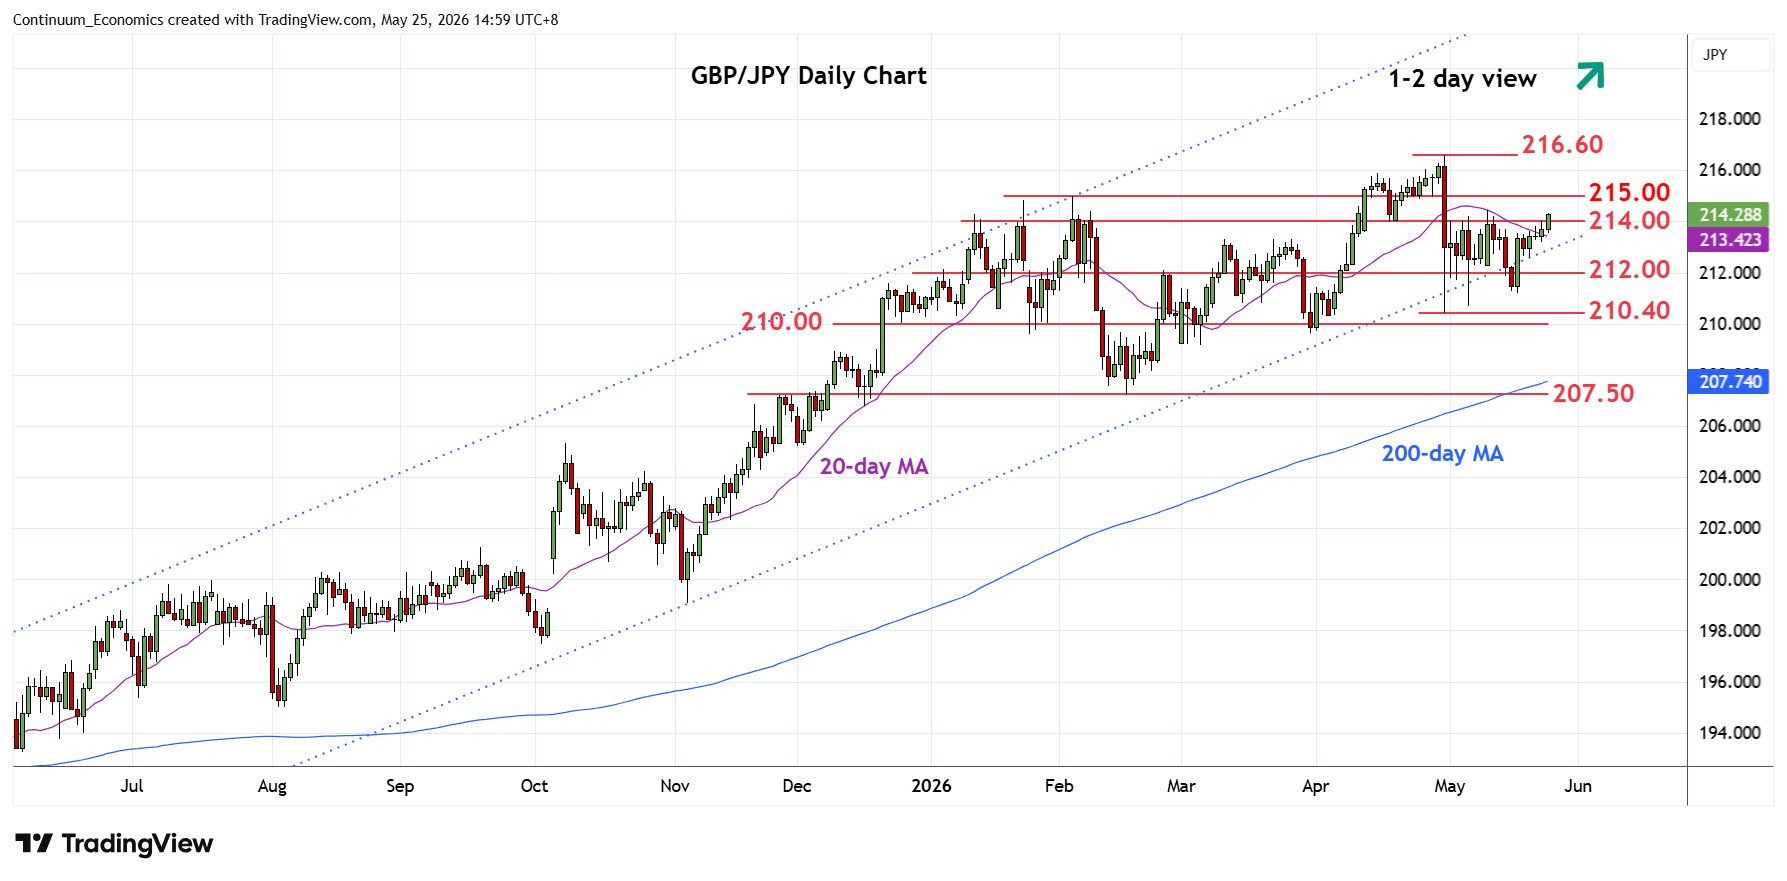
Extending bounce from the 211.20 low of last week to pressure resistance at the 214.00/40 congestion and 11 May high
| Levels | Imp | Comment | Levels | Imp | Comment | |||
|---|---|---|---|---|---|---|---|---|
| R4 | 216.60 | ** | 30 Apr YTD high | S1 | 212.60/00 | * | 20 May low, congestion | |
| R3 | 216.00 | * | congestion | S2 | 211.20 | ** | 18 May low | |
| R2 | 215.00 | * | Feb high, congestion | S3 | 210.40 | ** | 30 Apr low | |
| R1 | 214.00/40 | * | congestion, 11 May high | S4 | 210.00 | * | congestion |
Asterisk denotes strength of level
07:10 GMT - Extending bounce from the 211.20 low of last week to pressure resistance at the 214.00/40 congestion and 11 May high. Higher will see room to resistance at the 215.00 February high where reaction is expected as intraday and daily extend into overbought areas. Clearance, if seen, will return focus to the 216.00 level and 216.60, 30 April high. Meanwhile, support is raised to 212.60/212.00 congestion area which should underpin. Would take break here to return focus to the 211.20 and 210.40, 18 May and 30 April lows.