Published: 2026-10-21T00:46:29.000Z
Chart NZD/USD Update: Consolidating test of .5700
1
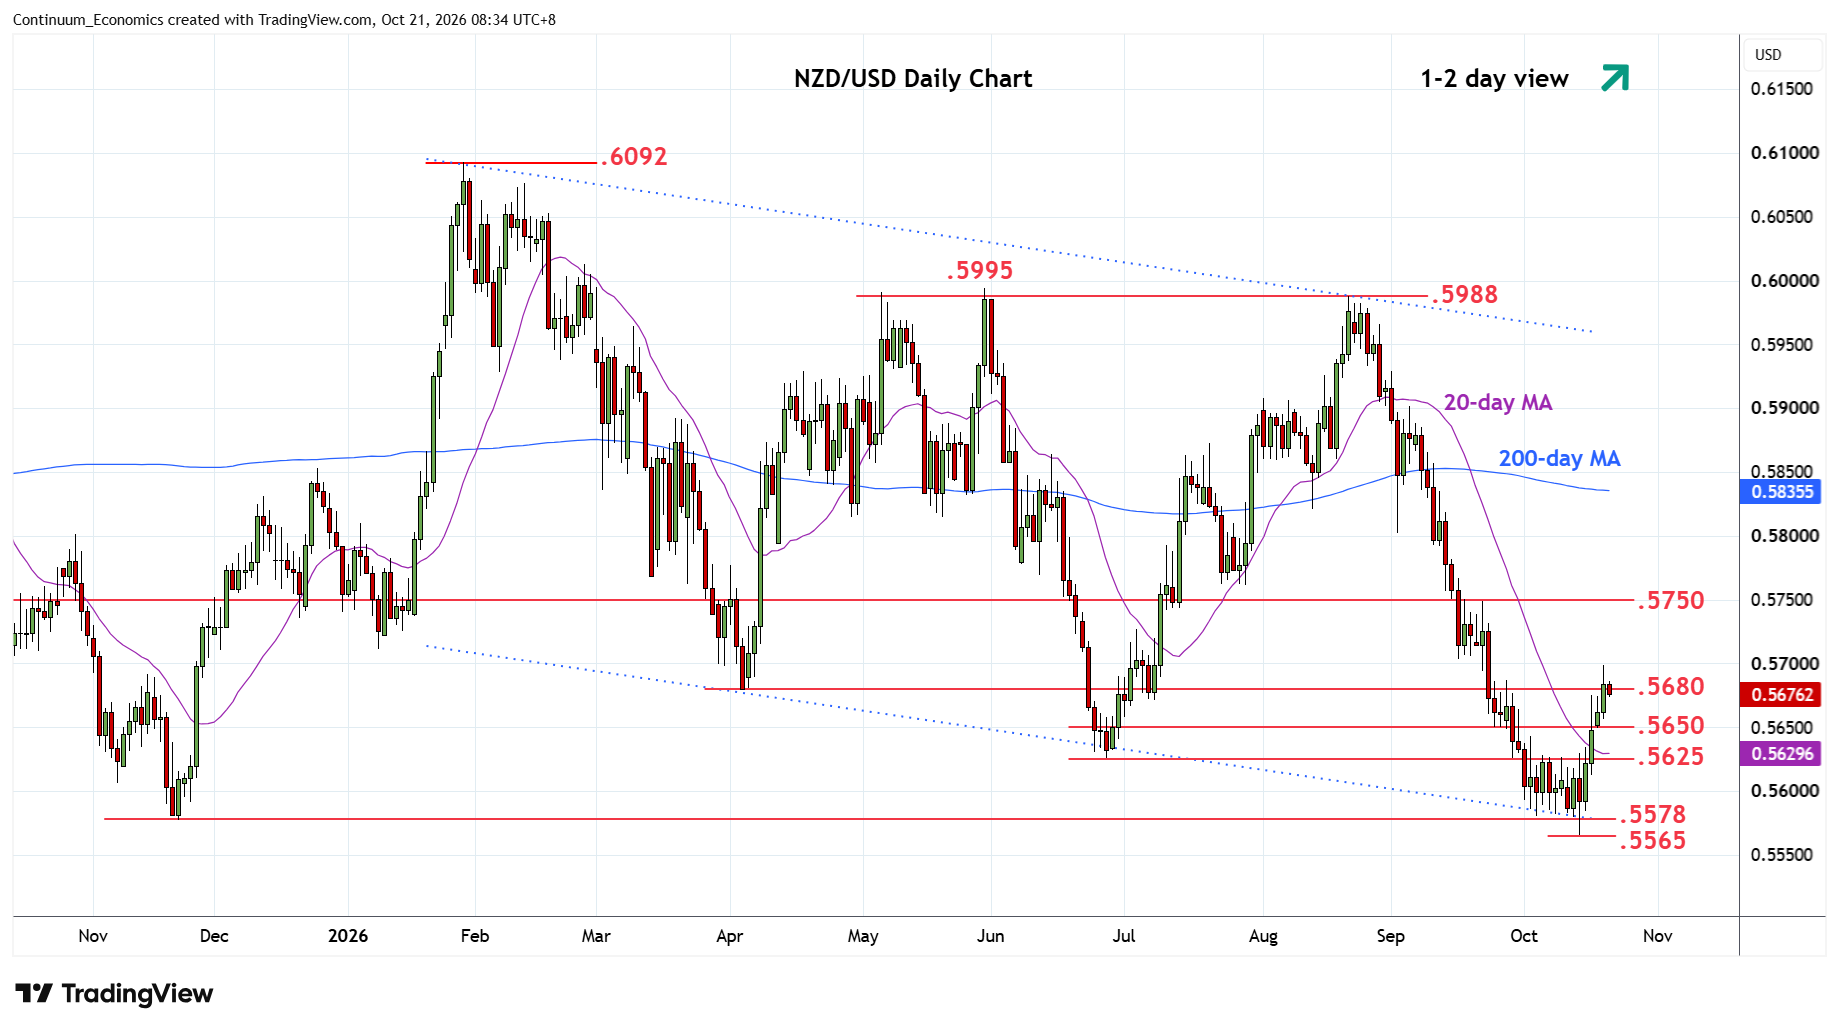
Saw break above the .5680 resistance to reach the .5700 level before settling back to consolidate gains from the .5565 low of last week
| Levels | Imp | Comment | Levels | Imp | Comment | |||
|---|---|---|---|---|---|---|---|---|
| R4 | .5850 | * | congestion | S1 | .5650 | * | congestion | |
| R3 | .5800 | ** | congestion | S2 | .5625 | * | Jun low | |
| R2 | .5750 | * | congestion | S3 | .5578 | * | Nov 2025 low | |
| R1 | .5700 | * | congestion | S4 | .5565 | ** | 14 Oct YTD low |
Asterisk denotes strength of level
00:35 GMT - Saw break above the .5680 resistance to reach the .5700 level before settling back to consolidate gains from the .5565 low of last week. Pause here see prices unwinding overbought intraday studies with positive daily studies suggesting room for further gains going forwards. Above the .5700 level will open up room for stronger gains to retrace losses from the .5988 high of August and see room to the resistance at .5750 congestion and the .5800 level. Meanwhile, support at the .5650/.5625 congestion and June low should underpin and limit corrective pullback.