Published: 2026-06-22T01:36:36.000Z
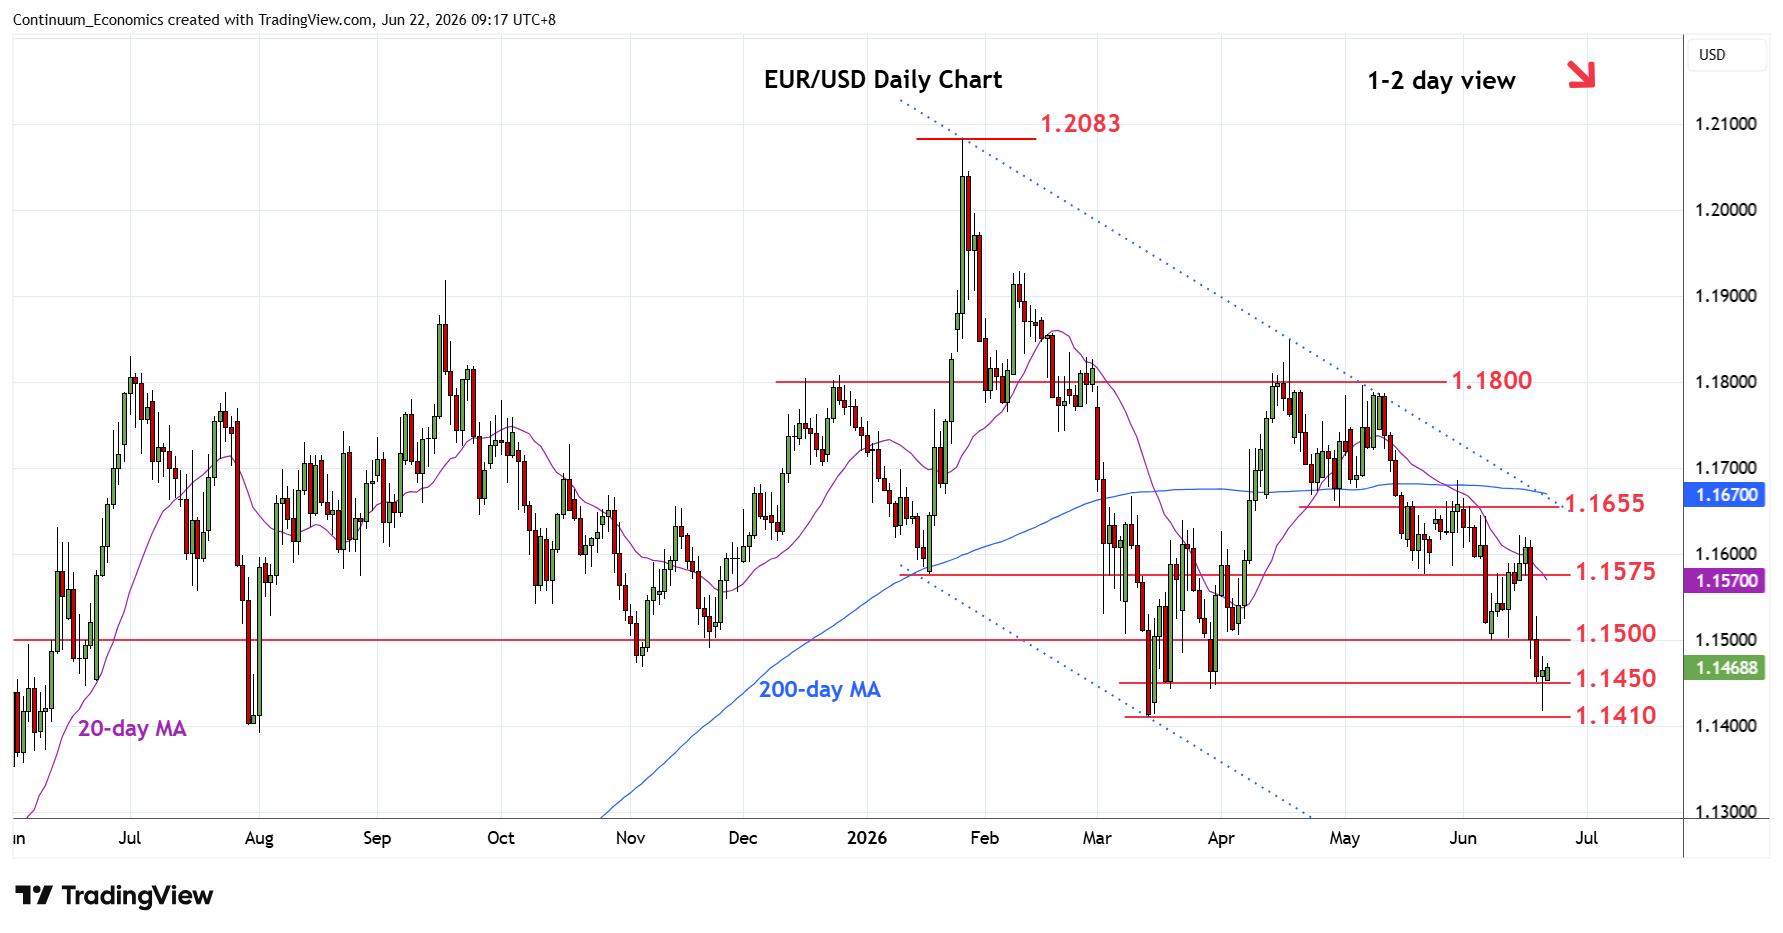
Chart EUR/USD Update: Consolidating above 1.1410 March current year low
-
Bounce from above support at the 1.1410 current year low of 13 March see prices settling into consolidation above 1.1450
| Levels | Imp | Comment | Levels | Imp | Comment | |||
|---|---|---|---|---|---|---|---|---|
| R4 | 1.1600/20 | ** | congestion, 15 Jun high | S1 | 1.1450 | * | congestion | |
| R3 | 1.1575 | ** | May low | S2 | 1.1410 | ** | 13 Mar YTD low | |
| R2 | 1.1550 | congestion | S3 | 1.1400 | * | figure | ||
| R1 | 1.1500 | ** | 8 Jun low | S4 | 1.1355 | * | 38.2% Jan 2025/Jan rally |
Asterisk denotes strength of level
01:25 GMT - Bounce from above support at the 1.1410 current year low of 13 March see prices settling into consolidation above 1.1450 congestion. Prices are unwinding oversold readings and suggest room for test higher to support turned resistance at 1.1500 which is expected to cap. Above here will ease the downside pressure and open up room for stronger gains to strong resistance at the 1.1550/75 area. Would take break of support at 1.1450/10 congestion and March YTD low to further extend losses from the January high and see room for extension to 1.1355, 38.2% Fibonacci level.