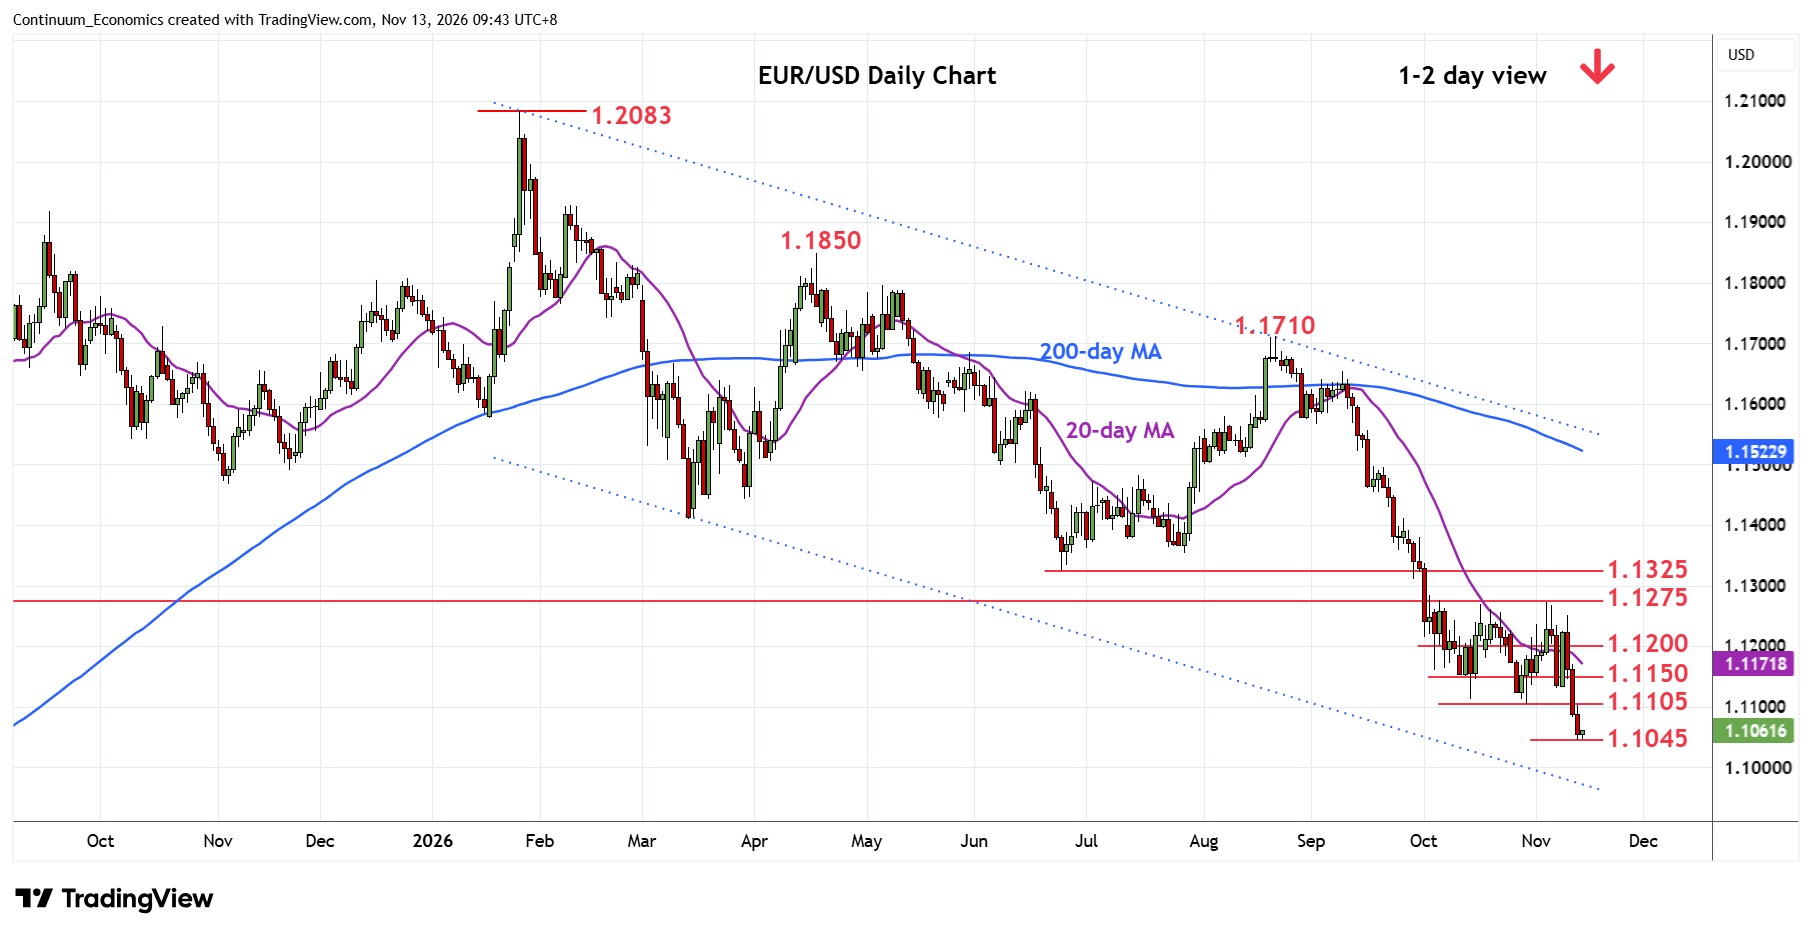
Chart EUR/USD Update: Consolidating, room for lower later
Break of the 1.1105 Octobe low see prices extending losses from the January 2026 current year high to reach fresh low at 1.1045
| Levels | Imp | Comment | Levels | Imp | Comment | |||
|---|---|---|---|---|---|---|---|---|
| R4 | 1.1275 | ** | 2023 year high | S1 | 1.1045 | * | 12 Nov YTD low | |
| R3 | 1.1200/10 | * | congestion, 2024 yr high | S2 | 1.1000 | ** | figure | |
| R2 | 1.1150 | * | congestion | S3 | 1.0955/50 | ** | Mar 2025 high, congestion | |
| R1 | 1.1105 | * | Oct low | S4 | 1.0905 | * | 61.8% 2025/2026 rally |
Asterisk denotes strength of level
01:50 GMT - Break of the 1.1105 Octobe low see prices extending losses from the January 2026 current year high to reach fresh low at 1.1045. Consolidation here see prices unwinding oversold intraday studies but the negative daily and weekly chart keep pressure on the downside and suggest scope for break later to open up room to the 1.1000 figure. Below this, will see room for extension to the 1.0955/50 area and 1.0905, 61.8% Fibonacci retracement. Meanwhile, resistance is lowered to the 1.1105/1.1150 area which is expected to cap and sustain losses from the 1.1710 August swing high.