Chart USD/JPY Update: Choppy trade - studies under pressure
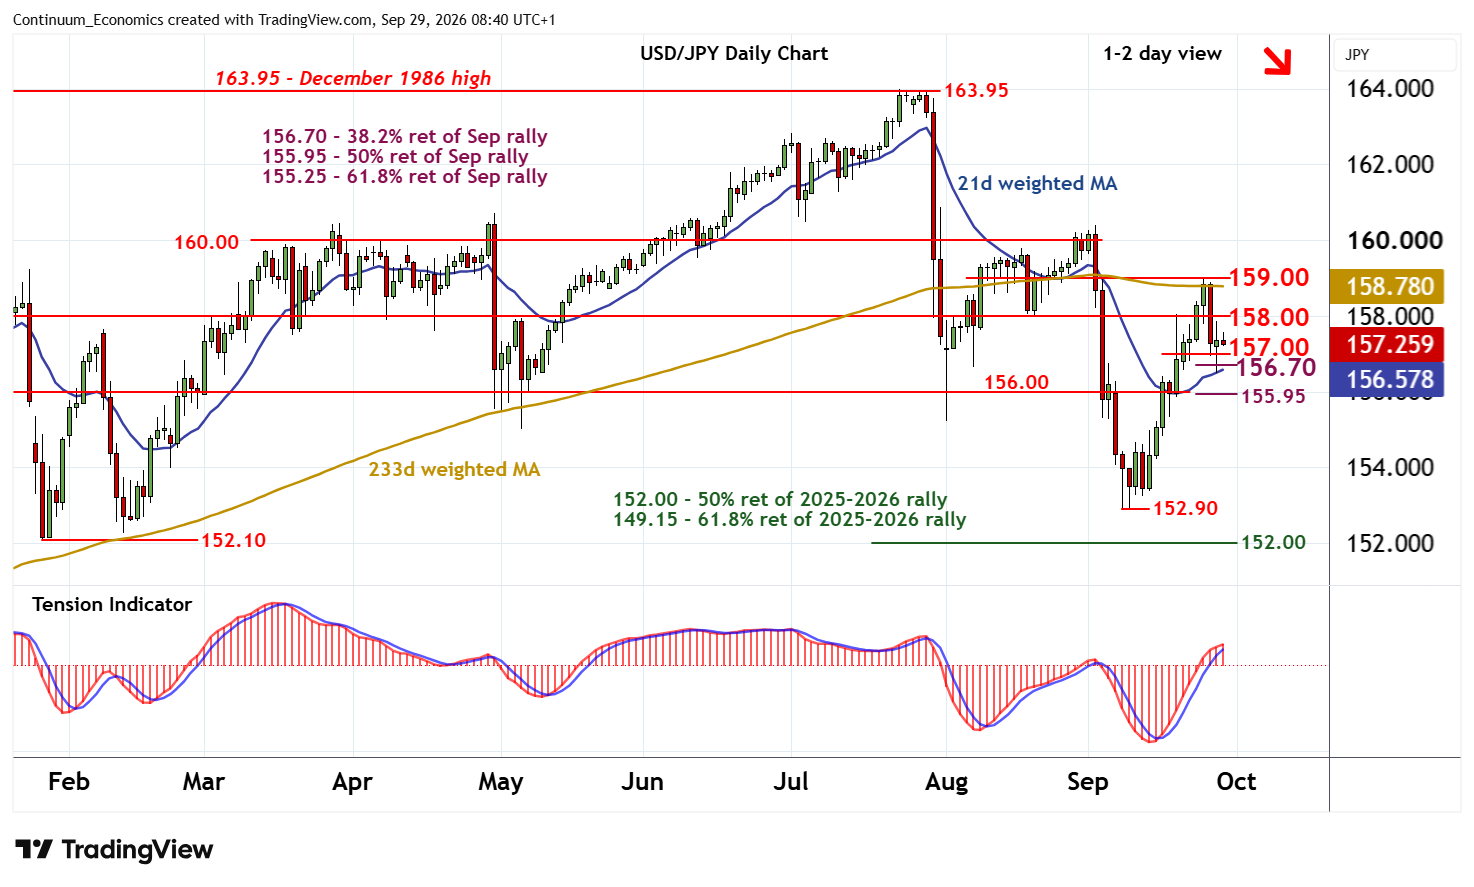
The anticipated test of support at the 156.70 Fibonacci retracement has extended to 156.50
| Levels | Imp | Comment | Levels | Imp | Comment | |||
|---|---|---|---|---|---|---|---|---|
| R4 | 160.00 | ** | congestion | S1 | 157.00 | congestion | ||
| R3 | 159.75 | ** | 61.8% ret of Jul-Sep fall | S2 | 156.70 | * | 38.2% ret of Sep rally | |
| R2 | 159.00 | * | congestion | S3 | 155.95/00 | ** | 50% ret; congestion | |
| R1 | 158.00 | ** | congestion | S4 | 155.25 | ** | 61.8% ret of Sep rally |
Asterisk denotes strength of level
08:30 BST - The anticipated test of support at the 156.70 Fibonacci retracement has extended to 156.50, before bouncing sharply into consolidation beneath 157.50. Overbought daily stochastics are unwinding and the rising daily Tension Indicator is flattening, suggesting a deterioration in sentiment and room for fresh tests lower. A fresh test of support at congestion around 157.00 and 156.70 is looked for. But unwinding oversold weekly stochastics could limit any initial tests in fresh consolidation, before the bearish weekly Tension Indicator and negative longer-term charts prompt a break. A close beneath here will add weight to sentiment and open up stronger support within 155.95/00.
Meanwhile resistance remains at congestion around 158.00. A close back above here, if seen, will help to stabilise sentiment and prompt consolidation beneath 159.00.