Published: 2026-05-19T07:17:53.000Z
Chart EUR/AUD Update: Extend corrective bounce from 1.6110 YTD low
1
Higher as prices extend bounce from the 13 May current year low at 1.6110 to unwind oversold daily studies
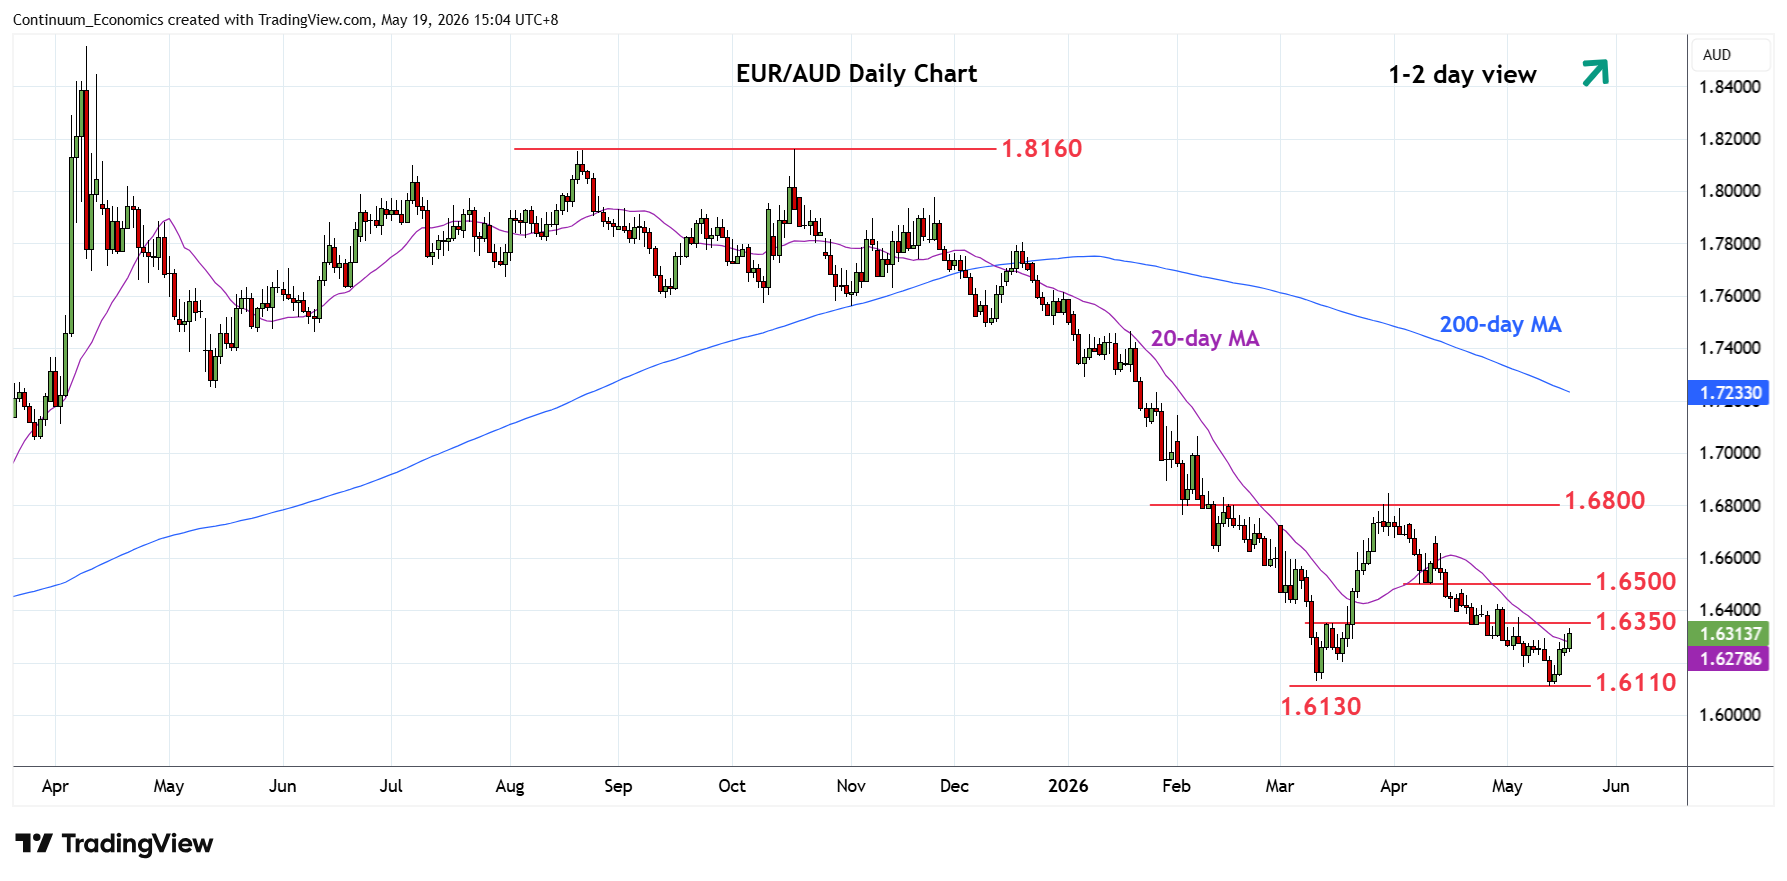
| Levels | Imp | Comment | Levels | Imp | Comment | |||
|---|---|---|---|---|---|---|---|---|
| R4 | 1.6600 | * | congestion | S1 | 1.6200 | * | congestion | |
| R3 | 1.6500 | ** | congestion, 8 Apr low | S2 | 1.6110 | ** | 13 May YTD low | |
| R2 | 1.6400/25 | * | congestion, 5 Mar low | S3 | 1.6000 | ** | figure, congestion | |
| R1 | 1.6350 | * | congestion | S4 | 1.5960 | ** | 2024 year low |
Asterisk denotes strength of level
07:15 GMT - Higher as prices extend bounce from the 13 May current year low at 1.6110 to unwind oversold daily studies. Above the 1.6200 level see room for stronger gains to retrace losses from the 1.6845 high of 31 March to resistance at 1.6350 and the 1.6400/25 congestion area. Clearance here, if seen, will open up room to the 1.6500/1.6600 congestion area. Meanwhile, support remains at the 1.6200 congestion which should underpin. Break here and the 1.6130/10 lows will see room for extension to the 1.6000 figure and 1.5960 support.