Chart USD/CAD Update: Consolidating test of 1.3980/00 - background studies under pressure
The anticipated test of support at the 1.3980 Fibonacci retracement and the 1.4000 break level is giving way to expected consolidation
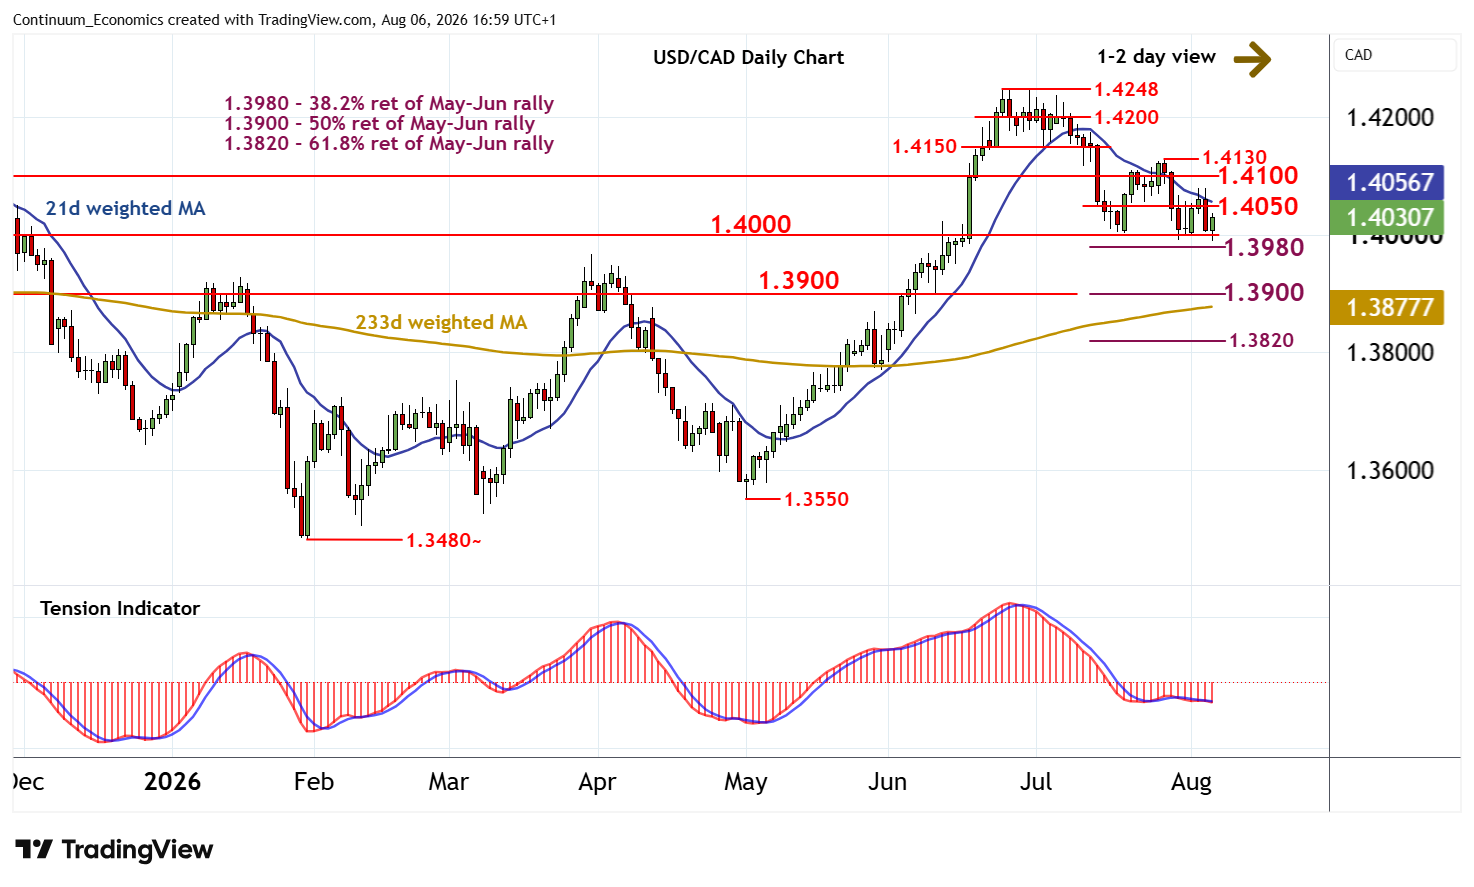
| Levels | Imp | Comment | Levels | Imp | Comment | |||
|---|---|---|---|---|---|---|---|---|
| R4 | 1.4150 | * | congestion base | S1 | 1.4000 | ** | break level | |
| R3 | 1.4130 | * | 28 Jul (w) high | S2 | 1.3980 | ** | 38.2% ret of May-Jun rally | |
| R2 | 1.4100 | * | congestion | S3 | 1.3930 | intraday lows | ||
| R1 | 1.4050 | break level | S4 | 1.3900 | ** | congestion, 50% ret |
Asterisk denotes strength of level
16:45 BST - The anticipated test of support at the 1.3980 Fibonacci retracement and the 1.4000 break level is giving way to expected consolidation, as oversold intraday studies unwind, with prices currently trading around 1.4030. Daily studies are mixed/negative and broader weekly charts are deteriorating, highlighting room for further losses in the coming sessions. A close beneath here will add weight to sentiment and extend late-June losses towards 1.3900. Meanwhile, a close back above resistance at 1.4050 would help to stabilise sentiment and prompt consolidation beneath congestion around 1.4100.