Published: 2026-10-22T01:14:37.000Z
Chart EUR/USD Update: Extend consolidation below 1.1275 resistance
1
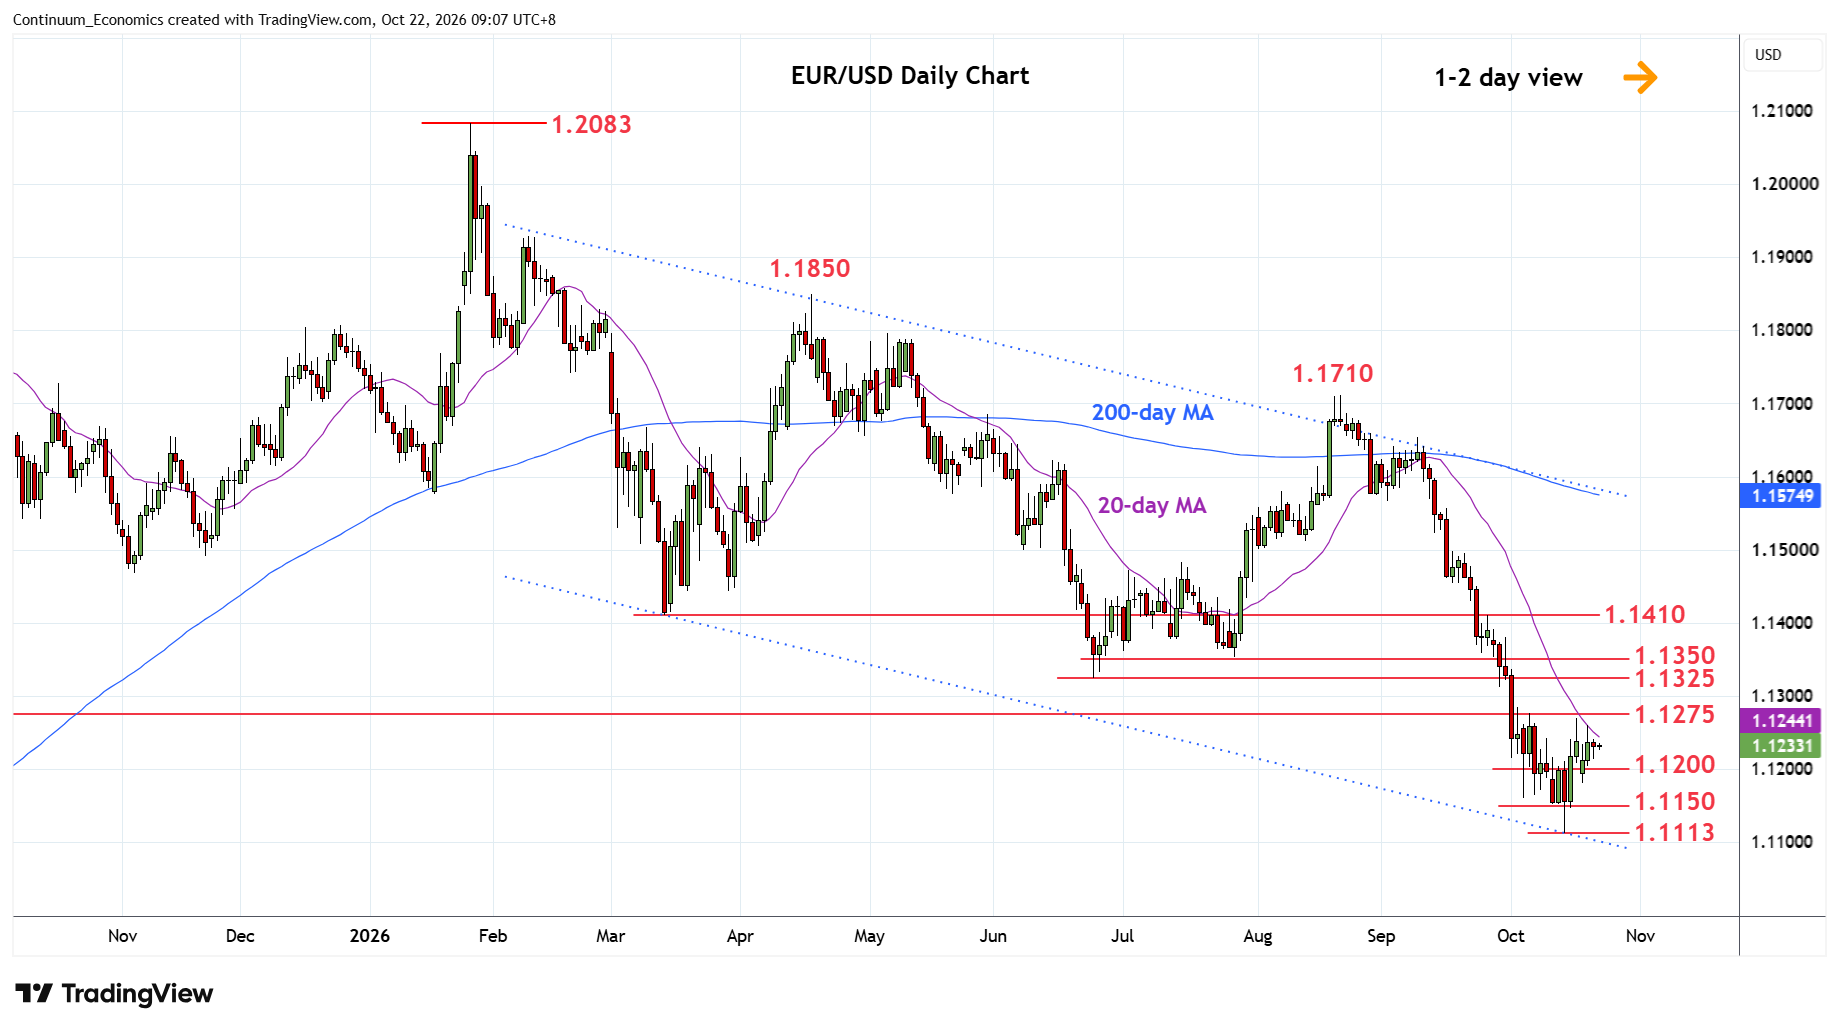
Little change, as prices extend consolidation below the 1.1275 resistance
| Levels | Imp | Comment | Levels | Imp | Comment | |||
|---|---|---|---|---|---|---|---|---|
| R4 | 1.1410 | ** | Mar low | S1 | 1.1200 | * | congestion | |
| R3 | 1.1350 | * | congestion | S2 | 1.1150 | * | congestion | |
| R2 | 1.1325 | ** | Jun low | S3 | 1.1113 | ** | 14 Oct YTD low | |
| R1 | 1.1275 | * | 2023 year high | S4 | 1.1100 | * | congestion |
Asterisk denotes strength of level
01:15 GMT - Little change, as prices extend consolidation below the 1.1275 resistance. Daily studies have turned mixed and suggest consolidation below here likely to extend though a later break cannot be ruled out to retrace losses from the 1.1710, August high. Above the 1.1275 resistance will open up room for extension to strong resistance at the 1.1325/50 June/July lows where reaction can be expected. Meanwhile, support at the 1.1200/1.1150 congestion area should underpin. Failure here will expose 1.1113 low to retest and further retrace the 2025/2026 rally.