Published: 2026-11-04T00:33:47.000Z
Chart AUD/USD Update: Under pressure
1
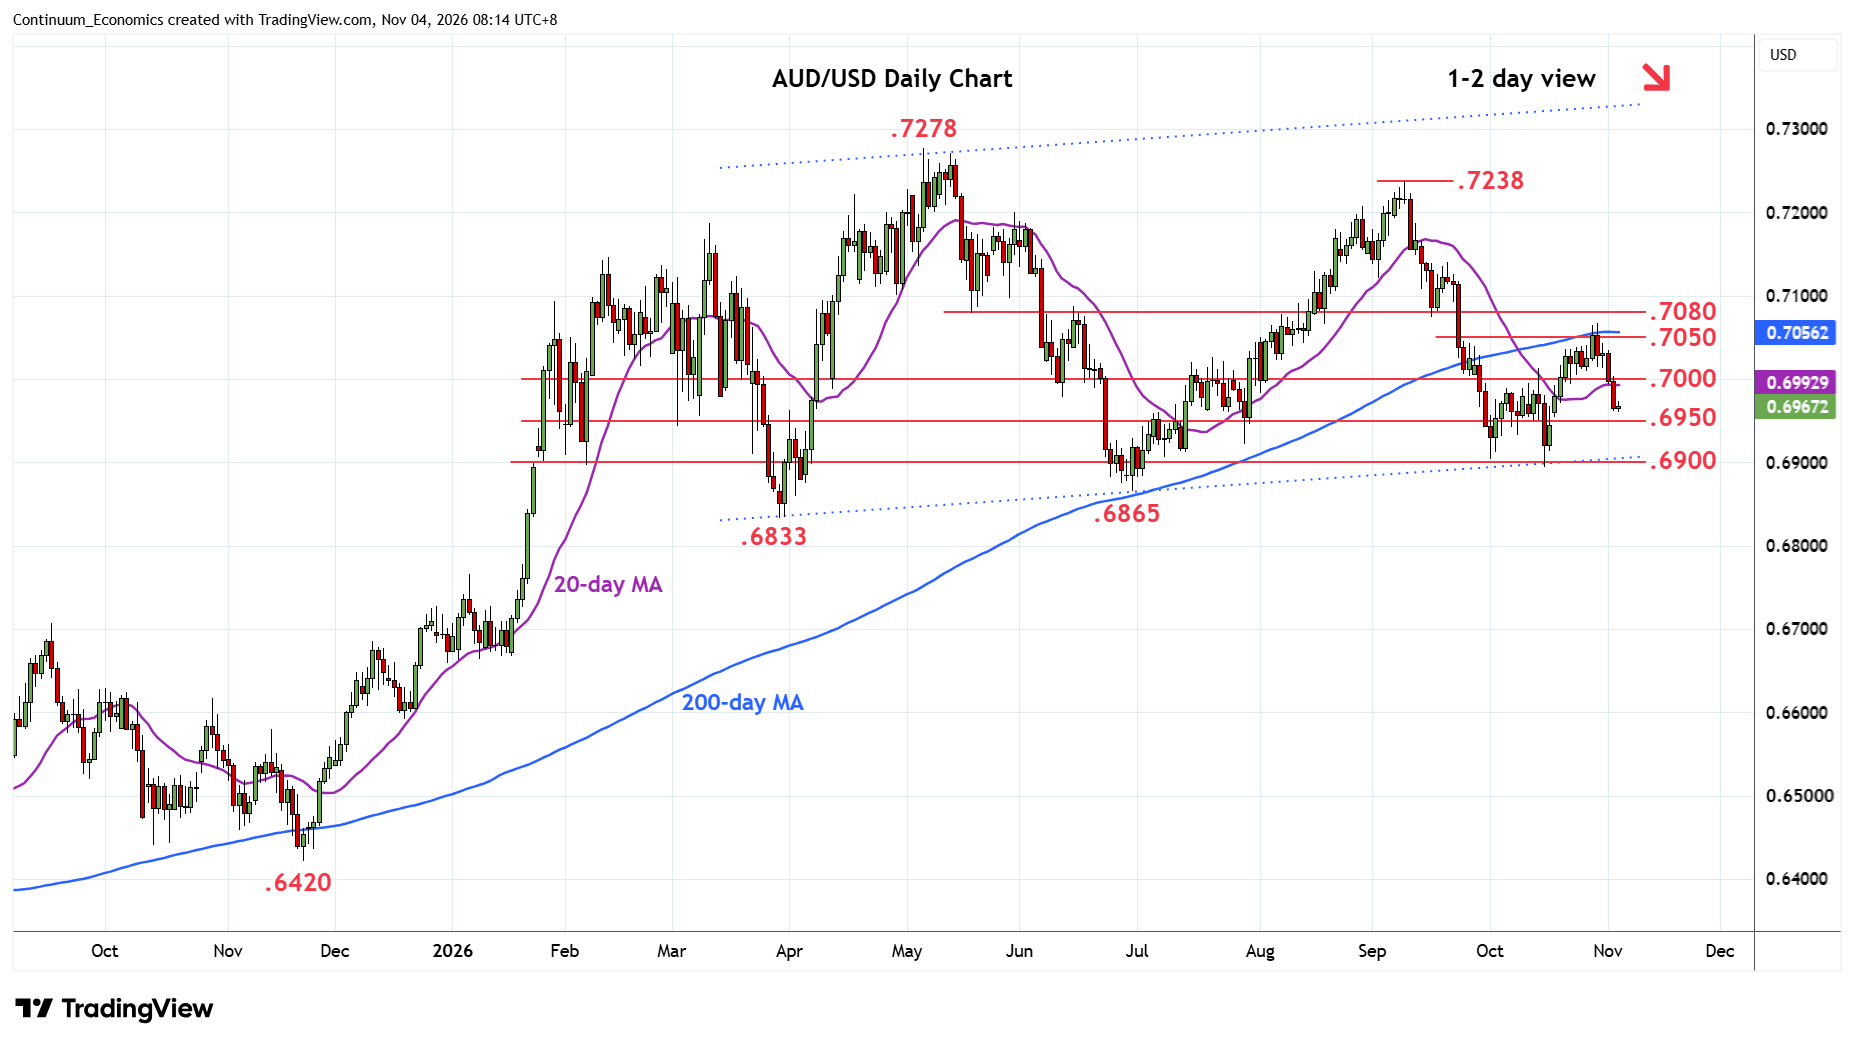
Prices under pressure with break of the .7000 level extending losses towards support at the .6950 congestion
| Levels | Imp | Comment | Levels | Imp | Comment | |||
|---|---|---|---|---|---|---|---|---|
| R4 | 0.7100/05 | * | congestion, 61.8% | S1 | 0.6950 | * | congestion | |
| R3 | 0.7080 | ** | May low, congestion | S2 | 0.6900 | ** | congestion, channel | |
| R2 | 0.7050/65 | * | congestion, 50% Sep/Oct fall | S3 | 0.6865 | ** | Jun low | |
| R1 | 0.7000 | * | figure, congestion | S4 | 0.6833 | ** | Mar low |
Asterisk denotes strength of level
00:20 GMT - Prices under pressure with break of the .7000 level extending losses towards support at the .6950 congestion. Daily studies continues to track lower and break here will threaten extension to retest the .6900 level and channel support. Meanwhile, resistance is lowered to the .7000 level which should cap and sustain losses from the high of last week. Regaining the .7000 level needed to ease the downside pressure and open up room for retest of .7050 congestion and .7065 Fibonacci retracement.