Chart EUR/GBP Update: Sharp pullback from strong resistance
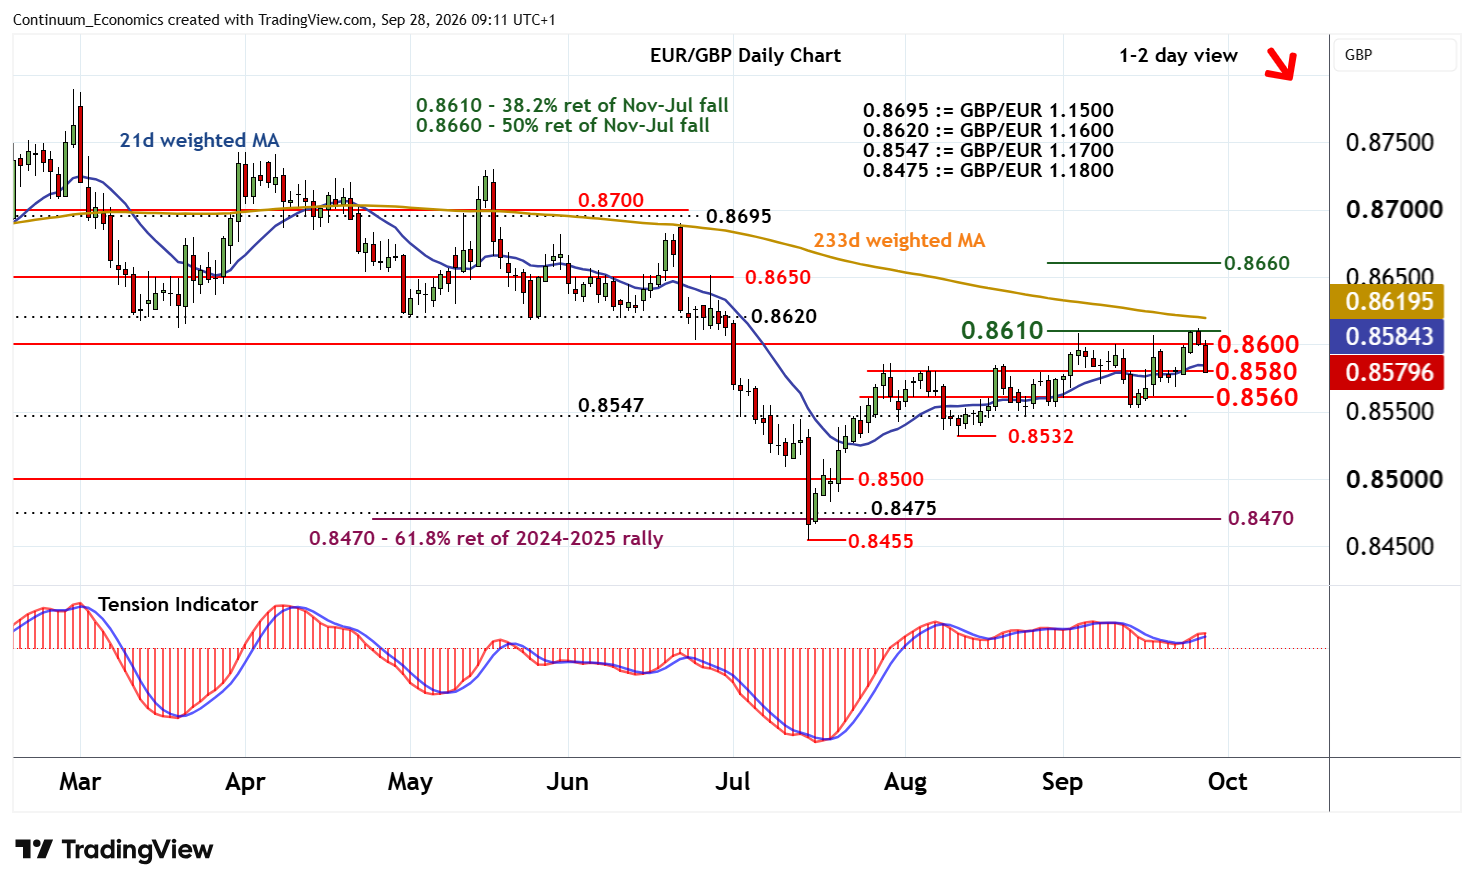
The test of resistance at congestion around 0.8600 and the 0.8610 Fibonacci retracement has given way to sharp selling interest
| Level | Comment | Level | Comment | |||||
|---|---|---|---|---|---|---|---|---|
| R4 | 0.8650 | ** | congestion | S1 | 0.8580 | * | break level | |
| R3 | 0.8620 | * | GBP/EUR 1.1600 | S2 | 0.8560 | * | congestion | |
| R2 | 0.8610 | * | 38.2% ret of Nov-Jul fall | S3 | 0.8547 | ** | GBP/EUR 1.1700 | |
| R1 | 0.8600 | ** | congestion | S4 | 0.8532 | ** | 12 Aug (m) low |
Asterisk denotes strength of level
09:05 BST - The test of resistance at congestion around 0.8600 and the 0.8610 Fibonacci retracement has given way to sharp selling interest, with prices currently pressuring support at 0.8580. Overbought daily stochastics are unwinding and the positive daily Tension Indicator is flattening, suggesting a deterioration in sentiment and room for further losses. A break below 0.8580 will open up congestion around 0.8560. But positive weekly charts should limit any tests in renewed buying interest/consolidation.
Meanwhile, resistance remains at 0.8600/10. A break above here, if seen, would help to improve sentiment and extend July gains beyond 0.8620, (GBP/EUR 1.1600), towards congestion around 0.8650.