Chart AUD/USD Update: Limited tests higher
Consolidation is giving way to anticipated tests higher
| Levels | Imp | Comment | Levels | Imp | Comment | |||
|---|---|---|---|---|---|---|---|---|
| R4 | 0.7277 | ** | 6 May YTD high | S1 | 0.7100 | ** | congestion | |
| R3 | 0.7250 | * | congestion | S2 | 0.7050 | * | congestion | |
| R2 | 0.7200 | ** | congestion | S3 | 0.7000 | * | congestion | |
| R1 | 0.7150 | * | congestion | S4 | 0.6950 | * | break level |
Asterisk denotes strength of level
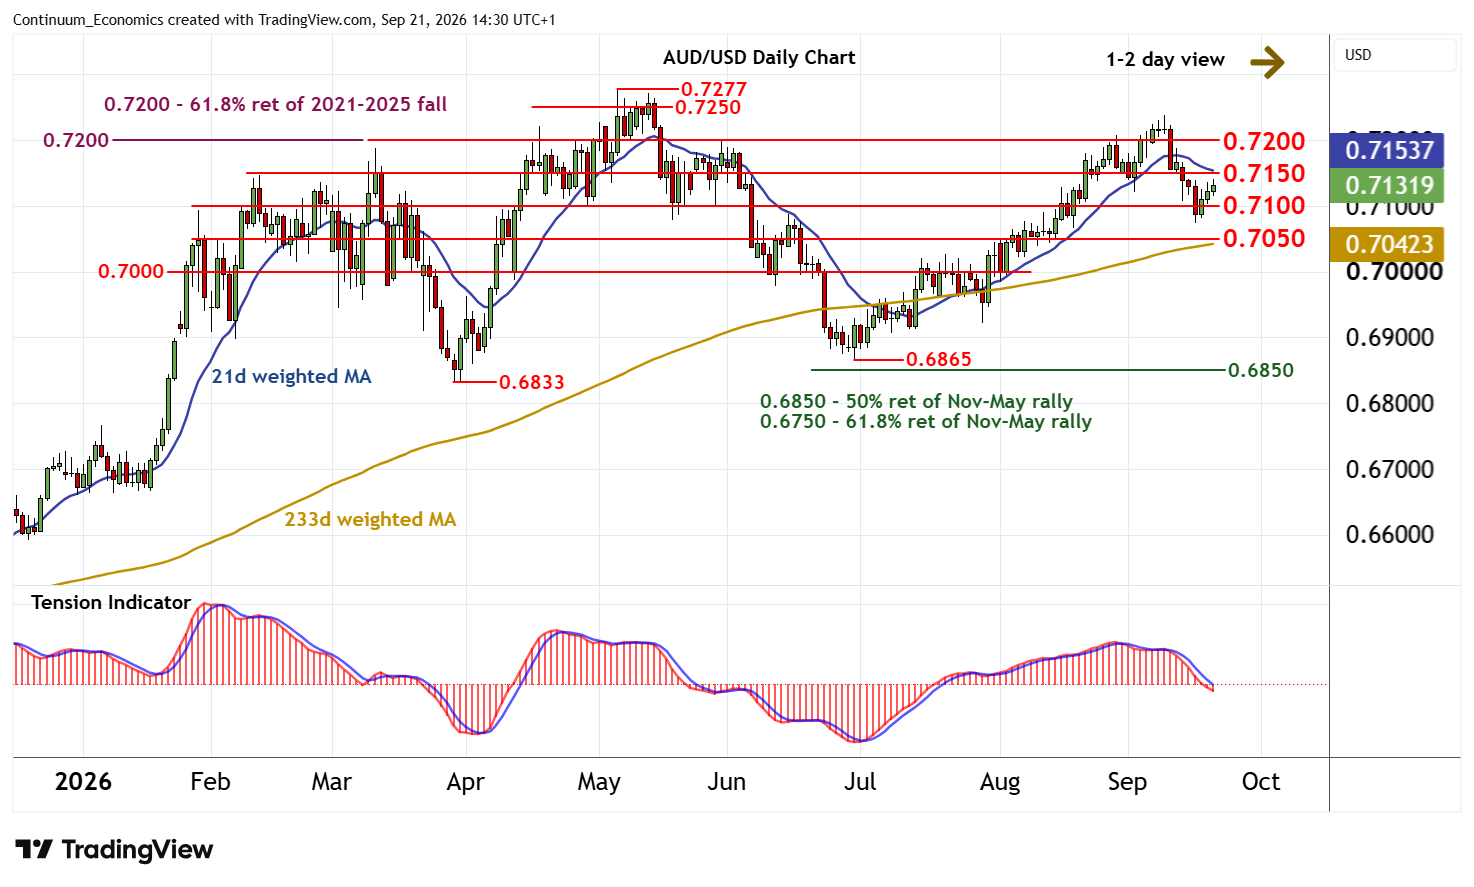
14:25 BST - Consolidation is giving way to anticipated tests higher, as oversold daily stochastics improve, with prices currently balanced around 0.7135. Focus is on congestion resistance at 0.7150. But the negative daily Tension Indicator and deteriorating weekly charts should limit any immediate tests in fresh consolidation. A close above here, if seen, will help to stabilise price action and prompt consolidation beneath further congestion around 0.7200.
Following cautious/corrective trade, fresh losses are looked for. A later close back below congestion support at 0.7100 will add weight to sentiment and extend September losses, initially towards further congestion around 0.7050.