Published: 2026-07-24T02:08:08.000Z
Chart GBP/USD Update: Consolidating test of 1.3300 May low
1
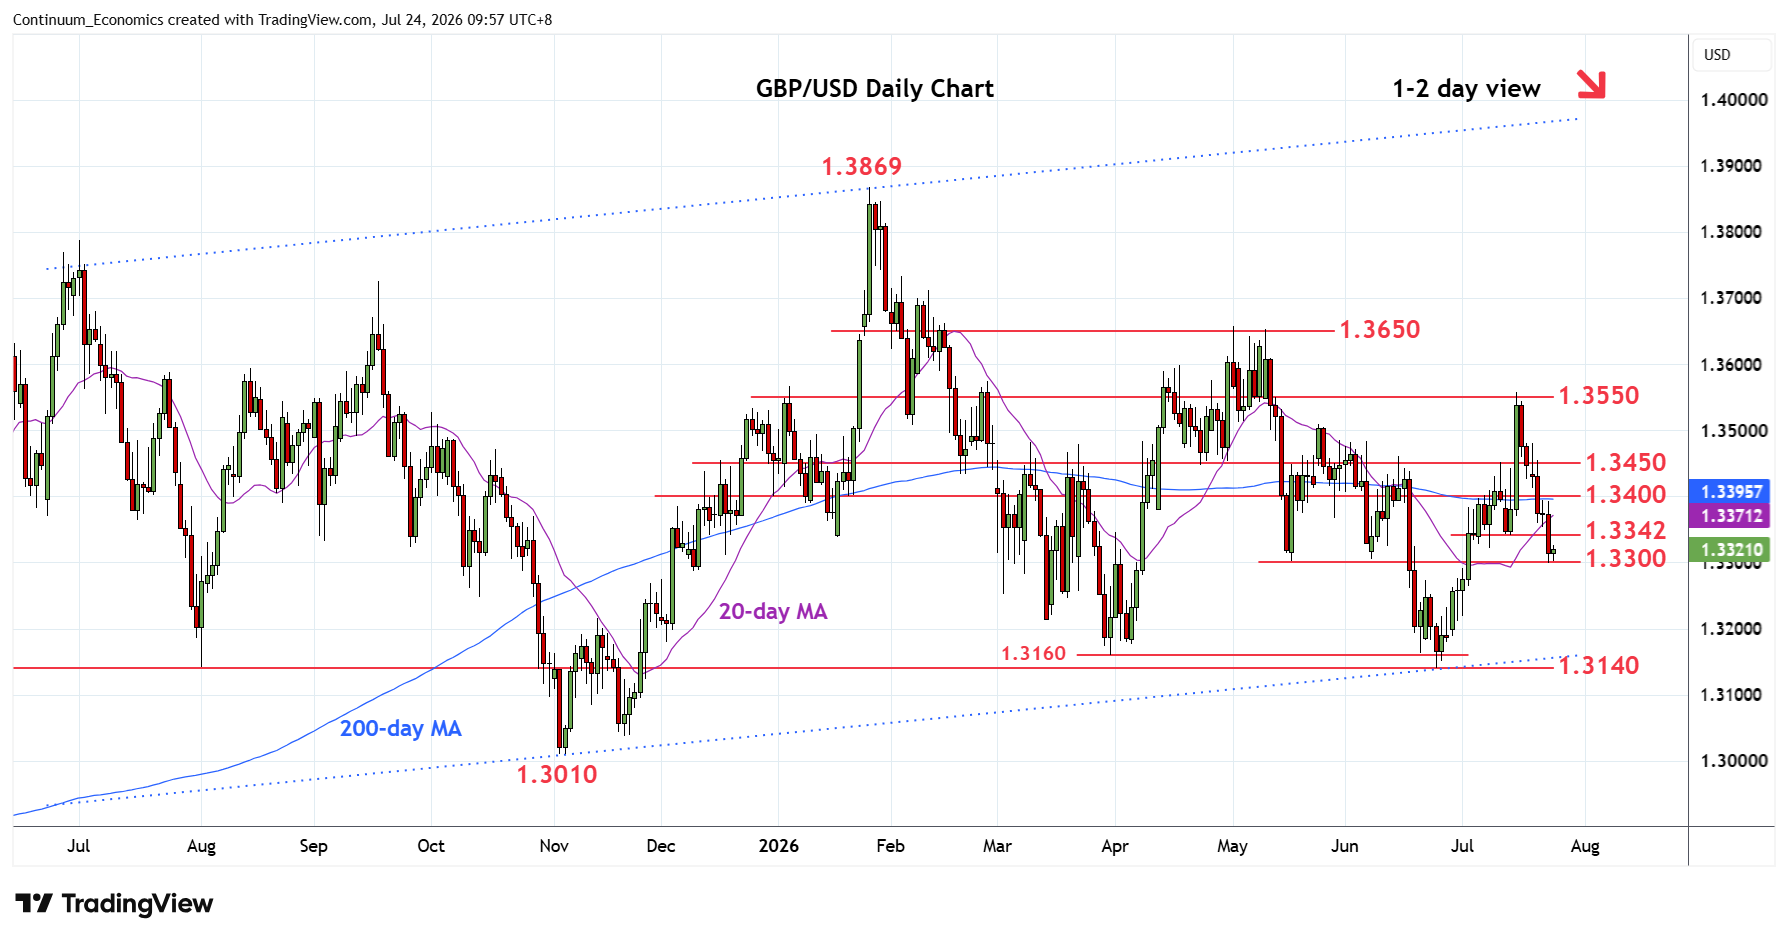
Consolidation above 1.3350/42 has given way to break to retest support at the 1.3300 May low
| Level | Comment | Level | Comment | |||||
|---|---|---|---|---|---|---|---|---|
| R4 | 1.3550/58 | ** | congestion, 15 Jul high | S1 | 1.3300 | ** | May low | |
| R3 | 1.3500 | * | congestion | S2 | 1.3250 | * | congestion | |
| R2 | 1.3450 | * | congestion | S3 | 1.3200 | * | congestion | |
| R1 | 1.3400 | * | congestion | S4 | 1.3140 | ** | 24 Jun YTD low |
Asterisk denotes strength of level
02:00 GMT - Consolidation above 1.3350/42 has given way to break to retest support at the 1.3300 May low. Negative daily studies weighs and suggest consolidation here giving way to fresh selling pressure later. Break here will further extend losses from the mid-July high and see room for extension to the 1.3250/00 congestion area. Meanwhile, resistance is lowered to the 1.3342/1.3400 congestion area which is expected to cap corrective bounce. Would need to regain these to ease the downside pressure and see room for stronger bounce back to 1.3450/1.3500.