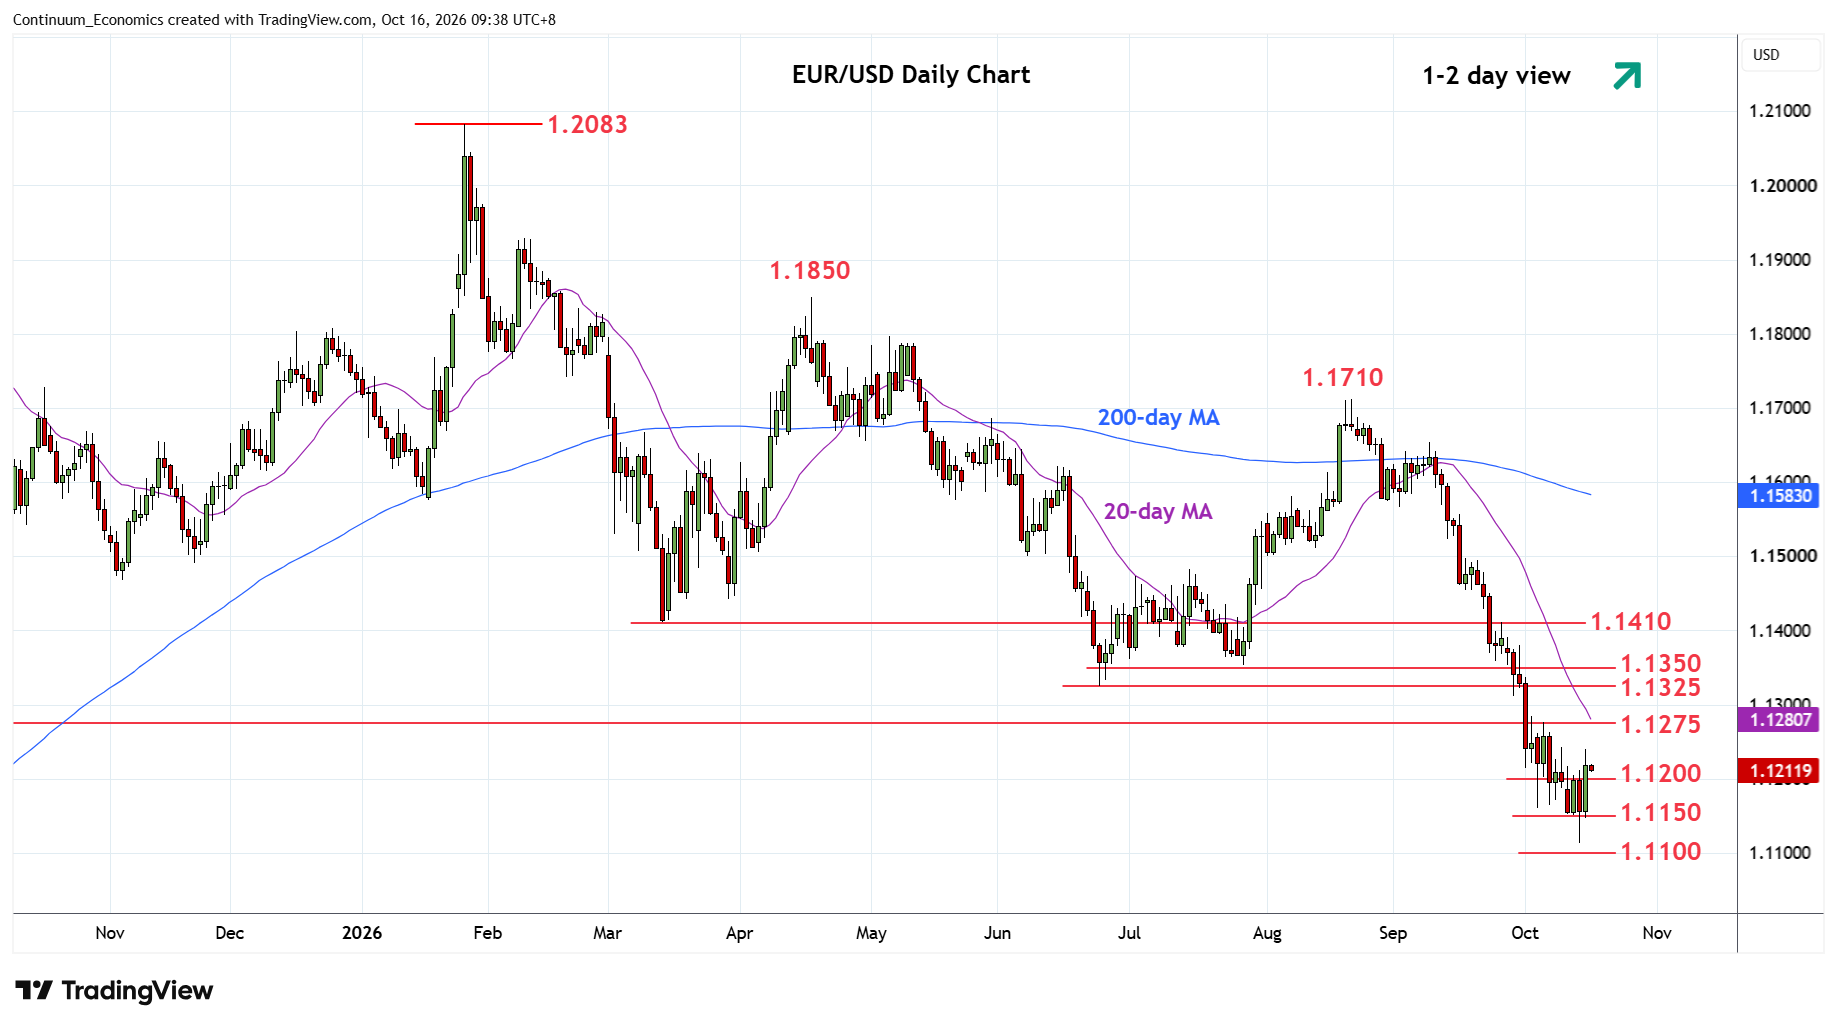
Chart EUR/USD Update: Extending bounce from 1.1113 current year low
Bounce from the 1.1113 mid-week low to regain the 1.1200 level see prices consolidating losses from mthe 1.1710 August swing high
| Levels | Imp | Comment | Levels | Imp | Comment | |||
|---|---|---|---|---|---|---|---|---|
| R4 | 1.1410 | ** | Mar low | S1 | 1.1200 | * | congestion | |
| R3 | 1.1350 | * | congestion | S2 | 1.1150 | * | congestion | |
| R2 | 1.1325 | ** | Jun low | S3 | 1.1113 | ** | 14 Oct YTD low | |
| R1 | 1.1275 | * | 2023 year high | S4 | 1.1100 | * | congestion |
Asterisk denotes strength of level
01:40 GMT - Bounce from the 1.1113 mid-week low to regain the 1.1200 level see prices consolidating losses from mthe 1.1710 August swing high. Daily studies have turned up from oversold areas and suggest scope for stronger bounce to retrace losses from the 1.1710, August high. Focus now turn towards resistance at the 1.1275, 2023 year high. Above here, will see room to strong resistance at the 1.1325/50 June/July lows where reaction can be expected. Meanwhile, support at the 1.1200/1.1150 congestion area should underpin. Below here will expose 1.1113 low to retest and further retrace the 2025/2026 rally.