Published: 2026-07-08T01:51:45.000Z
Chart GBP/USD Update: Lower in consolidation
2
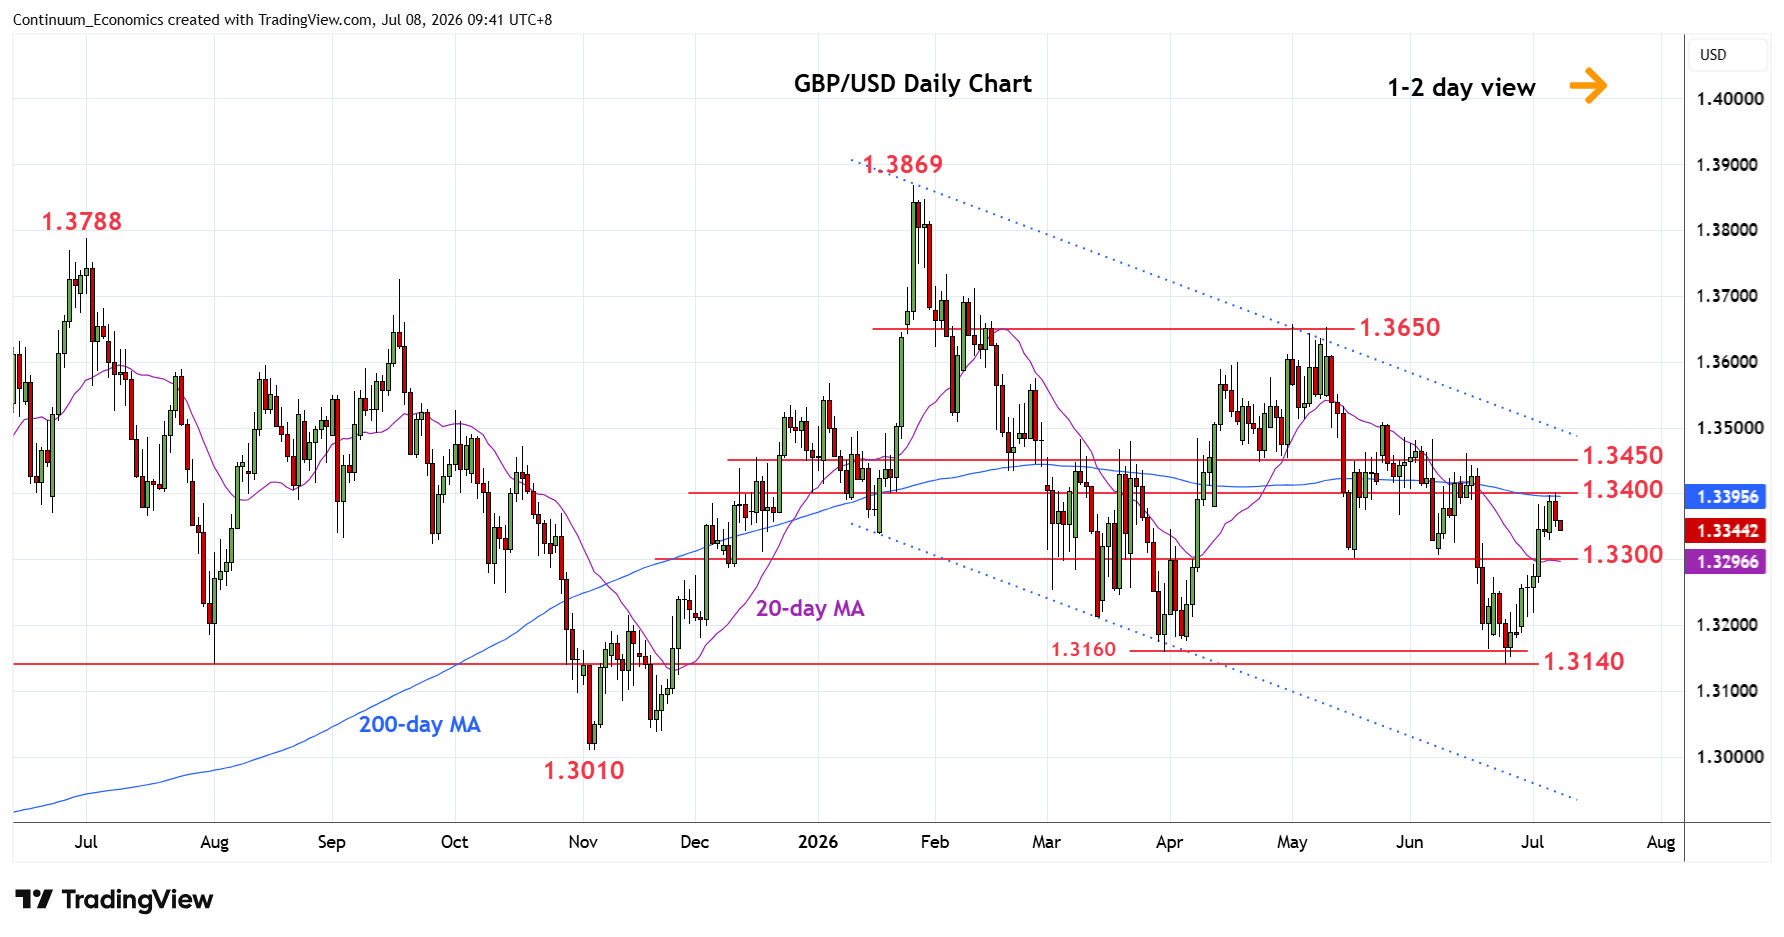
Settled back from test of the 1.3400 level and 200-day MA as prices unwind overbought daily studies
| Level | Comment | Level | Comment | |||||
|---|---|---|---|---|---|---|---|---|
| R4 | 1.3550 | * | congestion | S1 | 1.3300 | ** | May low | |
| R3 | 1.3500/10 | ** | congestion, 25 May high | S2 | 1.3250 | * | congestion | |
| R2 | 1.3450 | * | congestion | S3 | 1.3200 | * | congestion | |
| R1 | 1.3400 | * | congestion | S4 | 1.3140 | ** | 24 Jun YTD low |
Asterisk denotes strength of level
01:45 GMT - Settled back from test of the 1.3400 level and 200-day MA as prices unwind overbought daily studies. Pullback see prices consolidating strong gains from the 1.3140 June current year low with support at the 1.3350/00 congestion area expected to underpin. Would take break here to open up room for deeper pullback to the 1.3200 congestion and 1.3160/40 lows. Meanwhile, resistance at the 1.3400 level now expected to cap. A later break here, if seen, will further retrace the May/June losses and see room to 1.3450/1.3500 area.