Chart GBP/USD Update: Prices remain under pressure
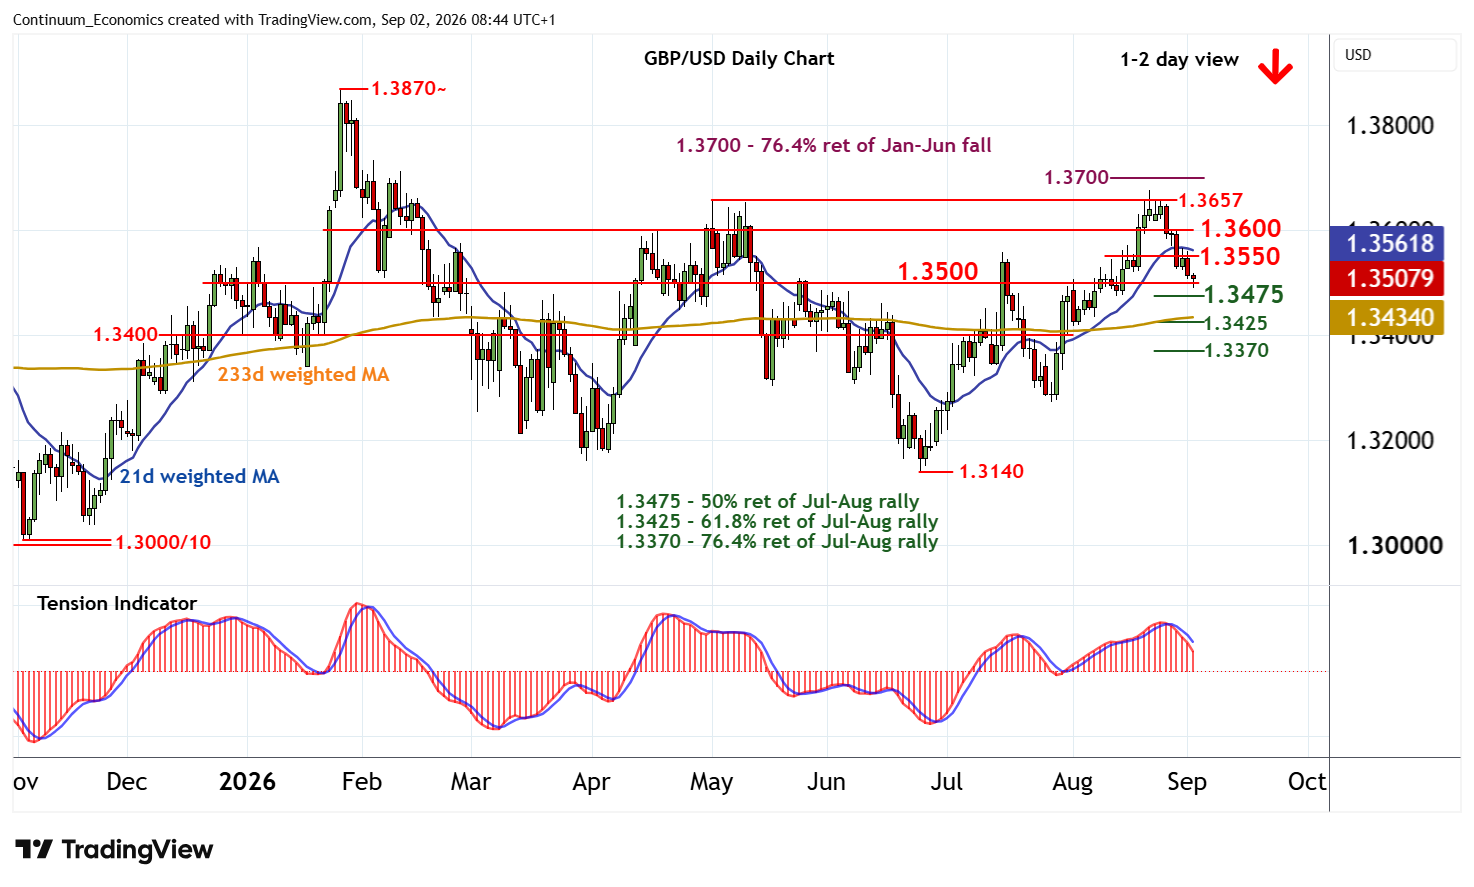
Anticipated losses have reached congestion support at 1.3500
| Level | Comment | Level | Comment | |||||
|---|---|---|---|---|---|---|---|---|
| R4 | 1.3700 | ** | congestion, 76.4% ret | S1 | 1.3500 | * | congestion | |
| R3 | 1.3657 | ** | 1 May (m) high | S2 | 1.3475 | ** | 50% ret of Jul-Aug rally | |
| R2 | 1.3600 | ** | congestion | S3 | 1.3425 | ** | 61.8% ret of Jul-Aug rally | |
| R1 | 1.3550 | * | congestion | S4 | 1.3400 | ** | congestion |
Asterisk denotes strength of level
08:10 BST - Anticipated losses have reached congestion support at 1.3500, where unwinding oversold intraday studies are prompting short-term reactions. Daily stochastics and the daily Tension Indicator continue to fall, and overbought weekly stochastics are also turning down, highlighting room for further losses in the coming sessions. A break beneath here will extend late-August losses towards the 1.3475 Fibonacci retracement. But already oversold daily stochastics could limit any initial tests in consolidation, before further losses are seen.
Meanwhile, resistance is lowered to congestion around 1.3550. A break above here, if seen, should give way to consolidation beneath further congestion around 1.3600.