Weekly Chart USD Index DXY: Room for a limited test lower - background studies remain positive
The break below 102.00 has reached congestion support at 101.50
The break below 102.00 has reached congestion support at 101.50,
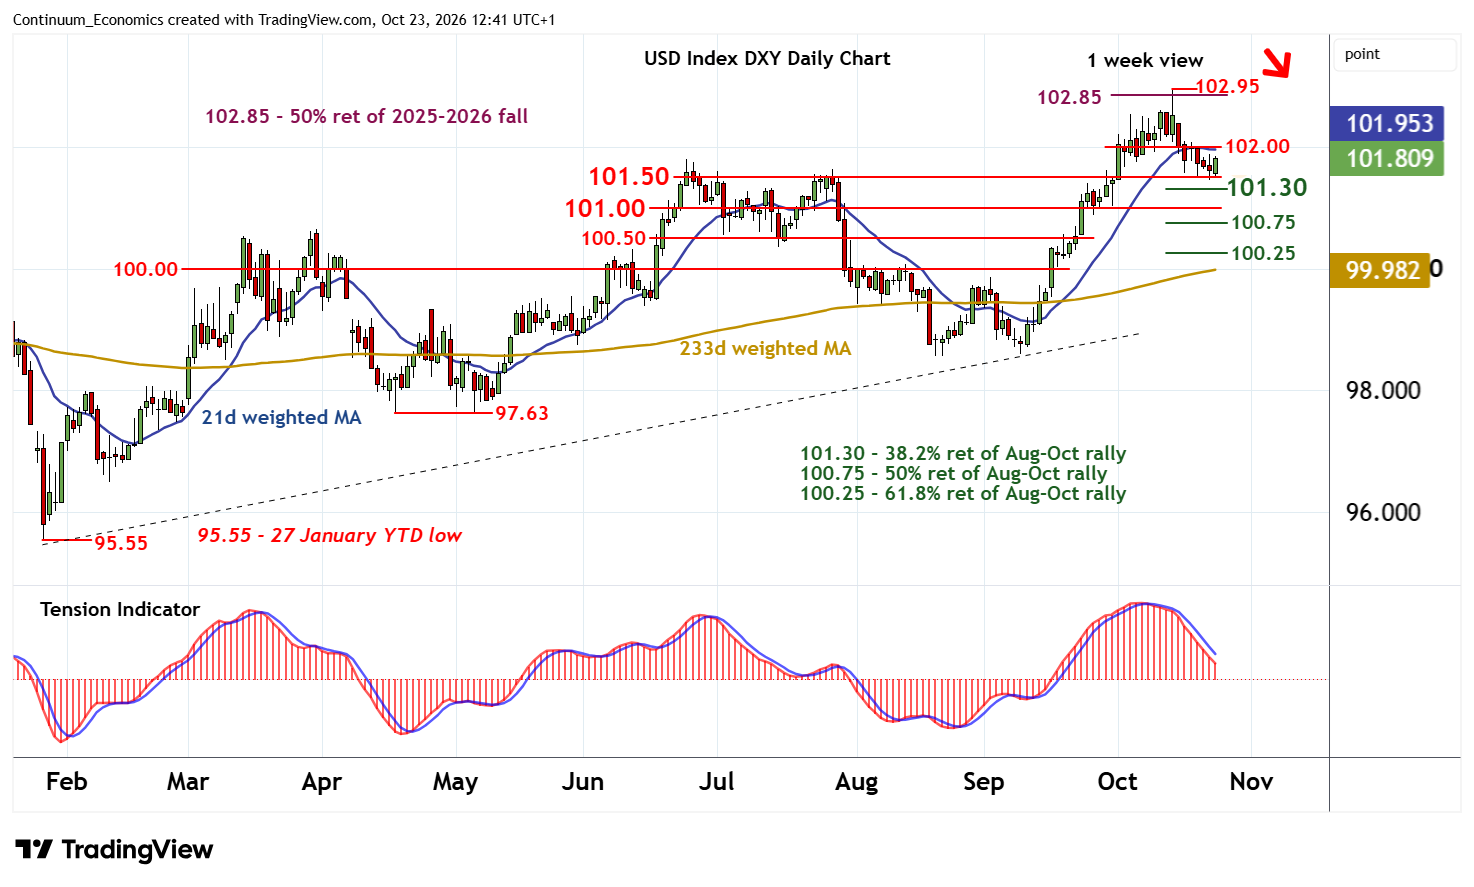
where a tick higher in oversold daily stochastics is prompting fresh consolidation. However, the daily Tension Indicator continues to point lower, highlighting room for further losses in the coming week. A close below 101.50 will add weight to sentiment and extend losses from the 102.95 current year high of 14 October towards the 101.30 Fibonacci retracement. A tick lower in overbought weekly stochastics points to room for a test beneath here. But the positive weekly Tension Indicator and rising longer-term readings should prompt fresh buying interest towards strong support within the 100.75 - 101.00 range.
Meanwhile, resistance is at 102.00 and extends to the 102.50 break level.
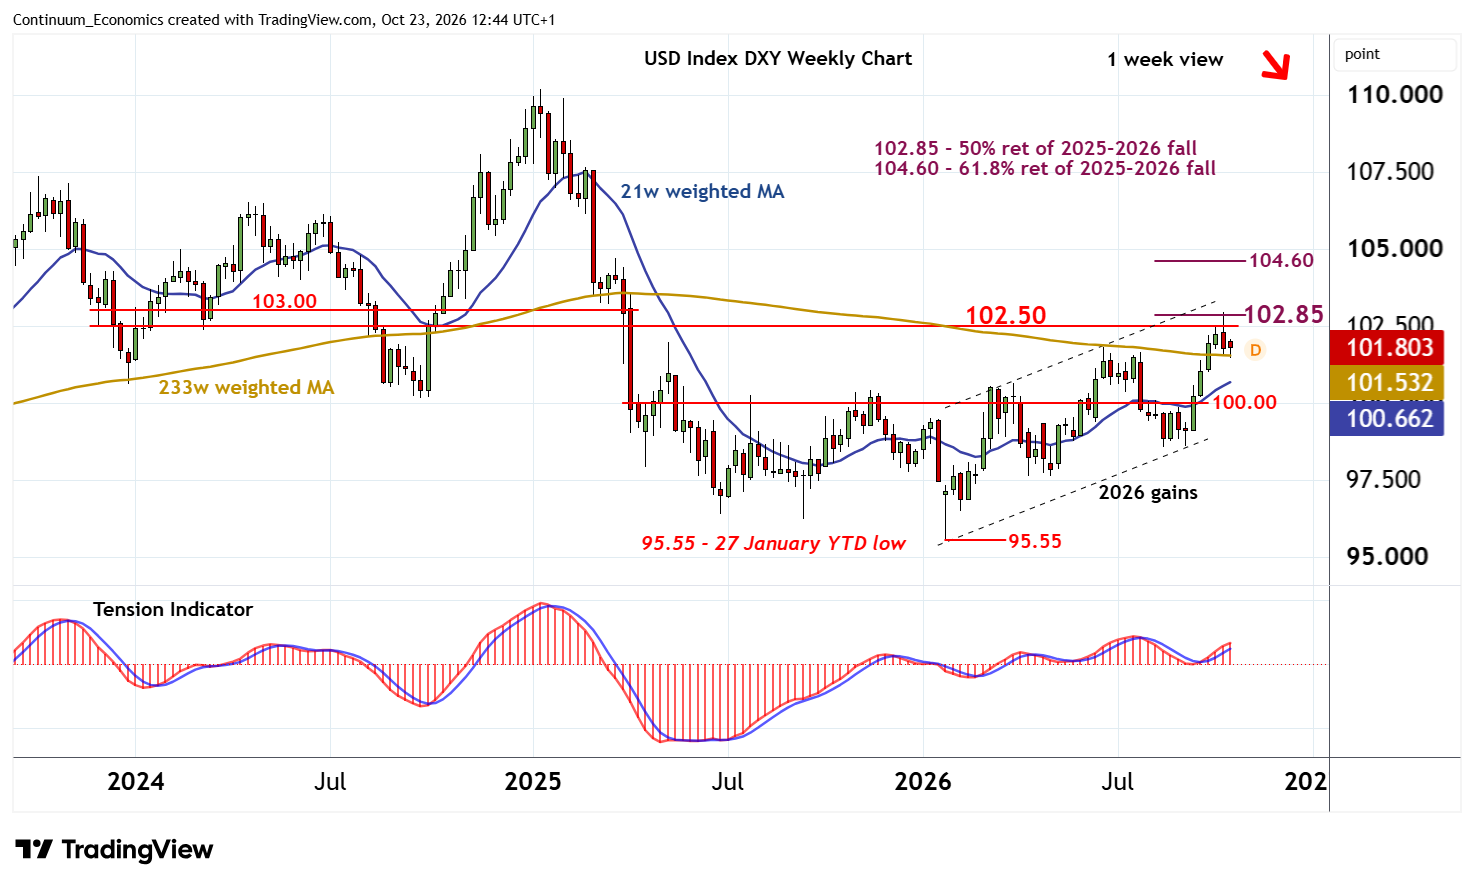
A close back above here, not yet seen, will help to stabilise price action. Longer-term charts are also positive. But a close above 102.85 is needed to turn sentiment positive and confirm continuation of January gains beyond congestion around 103.00. Longer-term focus will then turn to the 104.60 retracement.