Published: 2026-05-27T15:32:04.000Z
Chart USD/CAD Update: Strong resistance at the 1.3870 Fibonacci retracement
2
Cautious trade around 1.3800 has given way to a fresh push higher
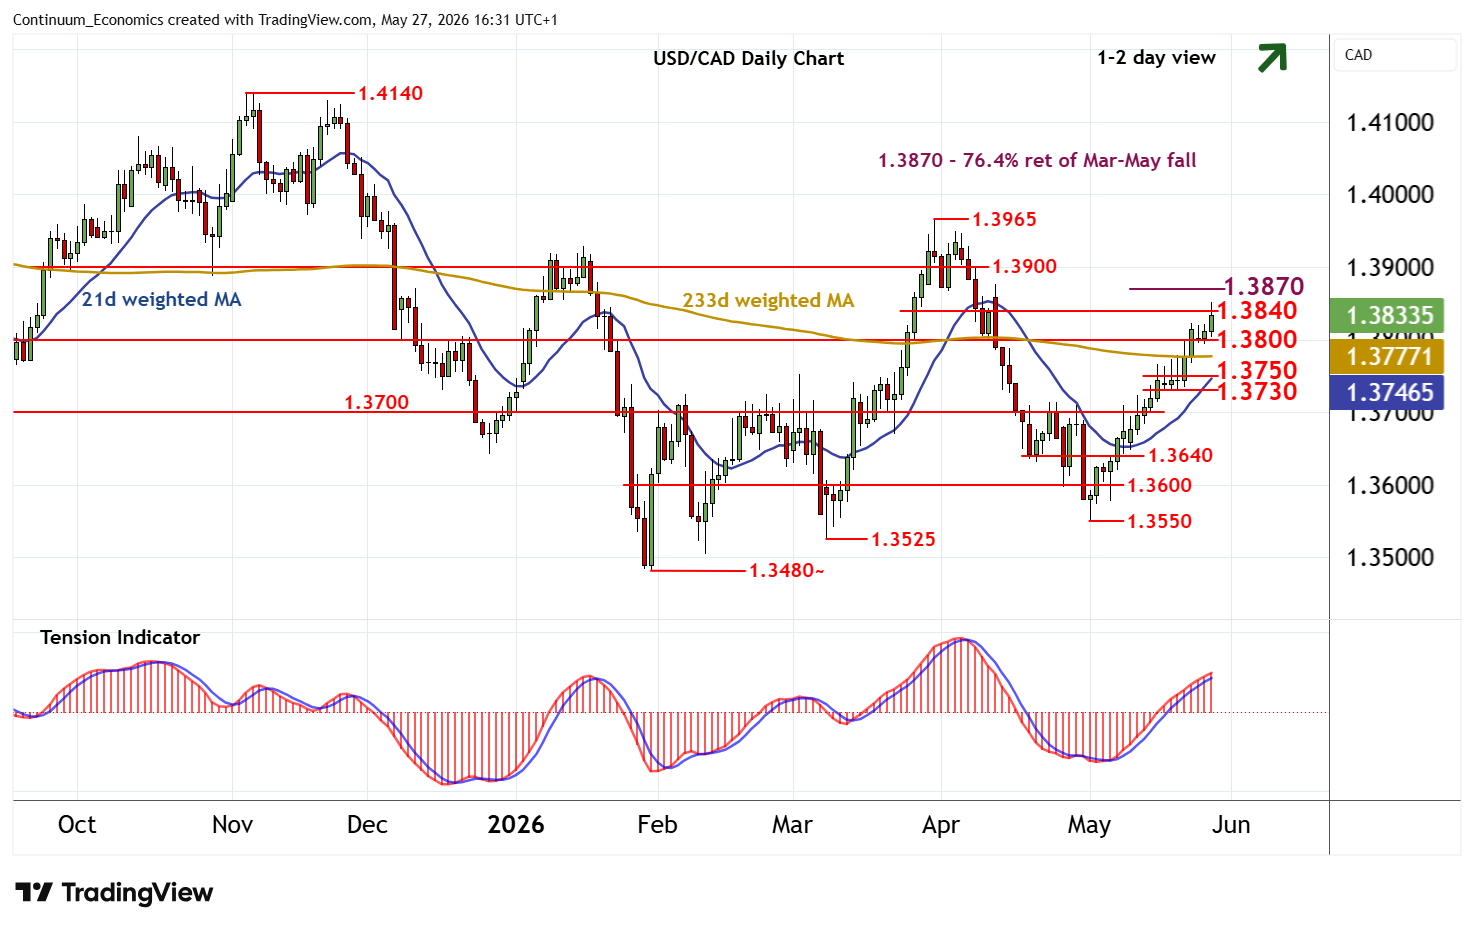
| Levels | Imp | Comment | Levels | Imp | Comment | |||
|---|---|---|---|---|---|---|---|---|
| R4 | 1.3965 | ** | 31 Mar YTD high | S1 | 1.3800 | * | congestion | |
| R3 | 1.3900 | ** | congestion | S2 | 1.3750 | congestion | ||
| R2 | 1.3870 | ** | 76.4% ret of Mar-May fall | S3 | 1.3730 | * | recent lows | |
| R1 | 1.3840 | intraday break level | S4 | 1.3700 | ** | congestion |
Asterisk denotes strength of level
16:15 BST - Cautious trade around 1.3800 has given way to a fresh push higher, with prices reaching 1.3840 before settling into consolidation. Intraday studies and the daily Tension Indicator are rising, suggesting room for continuation towards strong resistance at the 1.3870 Fibonacci retracement. But already overbought daily stochastics could limit any initial tests in profit-taking/consolidation, before improving weekly charts prompt further gains. Meanwhile, support is raised to congestion around 1.3800. A close beneath here, if seen, will help to stabilise sentiment and prompt consolidation above 1.3730 - 1.3750.