Published: 2026-07-20T00:24:49.000Z
Chart AUD/USD Update: Lower in consolidation from .7020
2
Remains in consolidation following pullback from test of the .7020 Fibonacci level
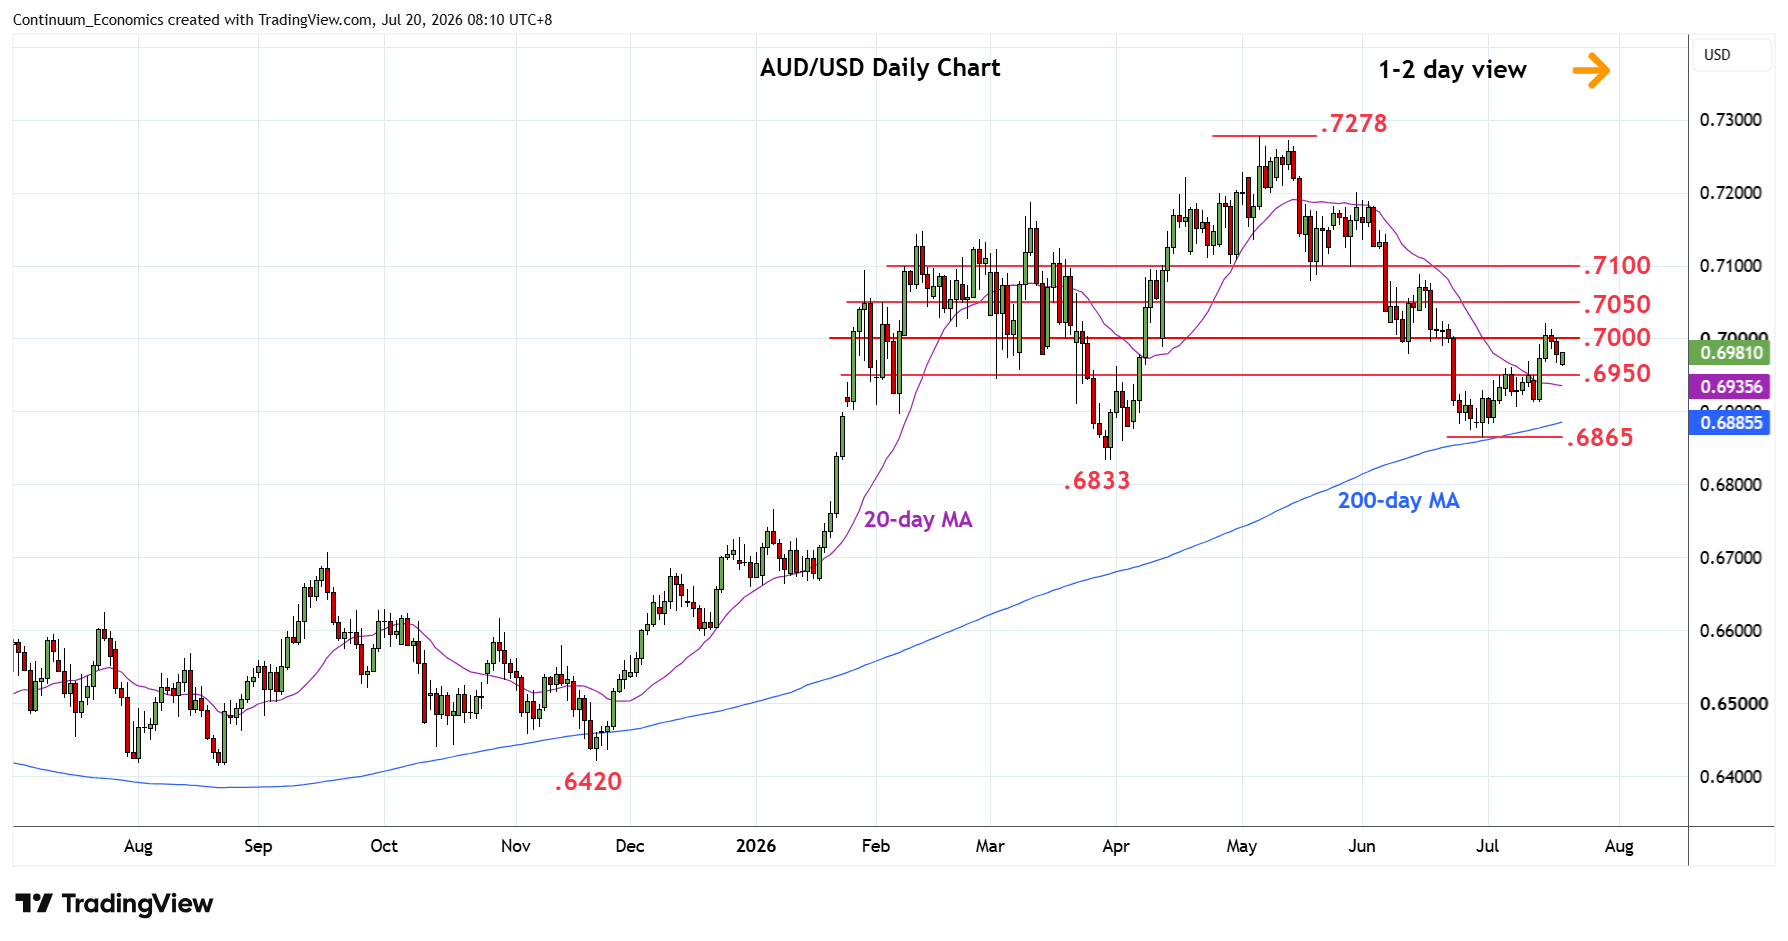
| Levels | Imp | Comment | Levels | Imp | Comment | |||
|---|---|---|---|---|---|---|---|---|
| R4 | 0.7120 | * | 61.8% May/Jun fall | S1 | 0.6950 | * | congestion | |
| R3 | 0.7100 | ** | congestion | S2 | 0.6912/00 | * | 14 Jul low, congestion | |
| R2 | 0.7070/80 | * | 50%, May low | S3 | 0.6865 | ** | Jun low | |
| R1 | 0.7020 | * | 38.2% May/Jun fall | S4 | 0.6833 | ** | Mar low |
Asterisk denotes strength of level
00:20 GMT - Remains in consolidation following pullback from test of the .7020 Fibonacci level with prices gapping lower at the start to reach .6962 low. Mixed daily and weekly studies suggest consolidation likely to extend before giving way to renewed buying interest later. Would take break above .7000/20 area to see room for extension to strong resistance at the .7080/.7100 area. Meanwhile, support remains at .6950 congestion which should underpin. Break here, if seen will return focus to the downside for retest of support at .6912/00 area and .6865 June low.