Chart EUR/NOK Update: Consolidating gains - studies remain positive
Anticipated gains have reached congestion resistance at 10.8500
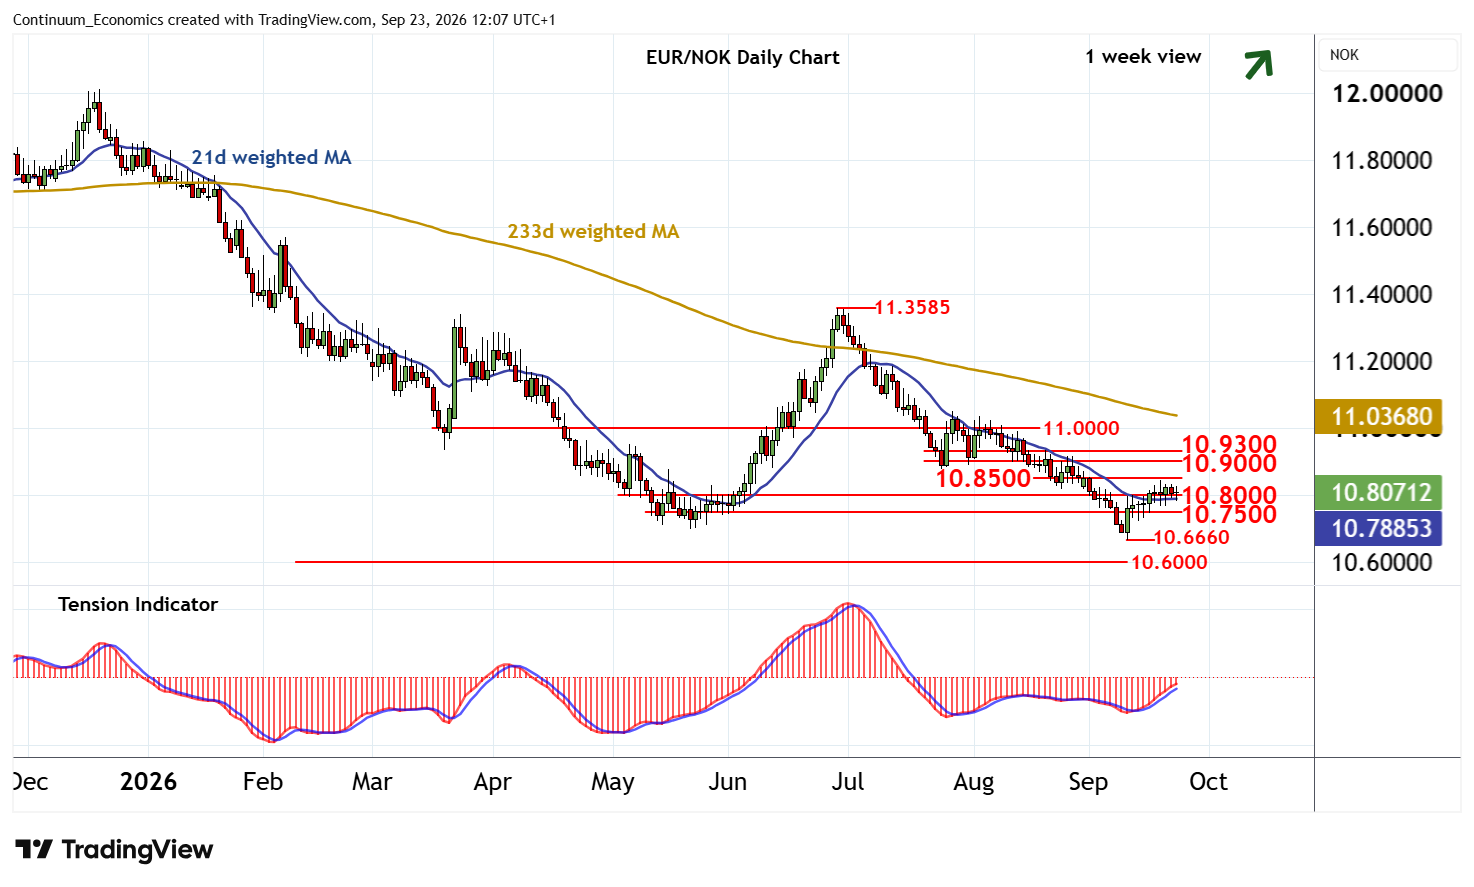
| Levels | Imp | Comment | Levels | Imp | Comment | |||
|---|---|---|---|---|---|---|---|---|
| R4 | 11.0000 | ** | break level | S1 | 10.8000 | * | break level | |
| R3 | 10.9300 | * | break level | S2 | 10.7500 | * | range lows | |
| R2 | 10.9000 | * | congestion | S3 | 10.6660 | ** | 10 Sep YTD low | |
| R1 | 10.8500 | * | congestion | S4 | 10.6000 | ** | congestion |
Asterisk denotes strength of level
12:00 BST - Anticipated gains have reached congestion resistance at 10.8500, where a tick lower in overbought daily stochastics is prompting a pullback into consolidation above 10.8000. The daily Tension Indicator continues to rise and bearish weekly readings are flattening, suggesting room for a test above 10.8500. Focus will then turn to congestion within the 10.9000 - 10.9300 range. However, mixed/negative weekly charts should limit any tests in renewed selling interest/consolidation.
Meanwhile, support is at 10.8000 and extends to the 10.7500 range lows. A later break beneath here will add weight to sentiment. But a close below the 10.6660 current year low of 10 September is needed to turn sentiment negative and extend April 2025 losses towards historic congestion around 10.6000.