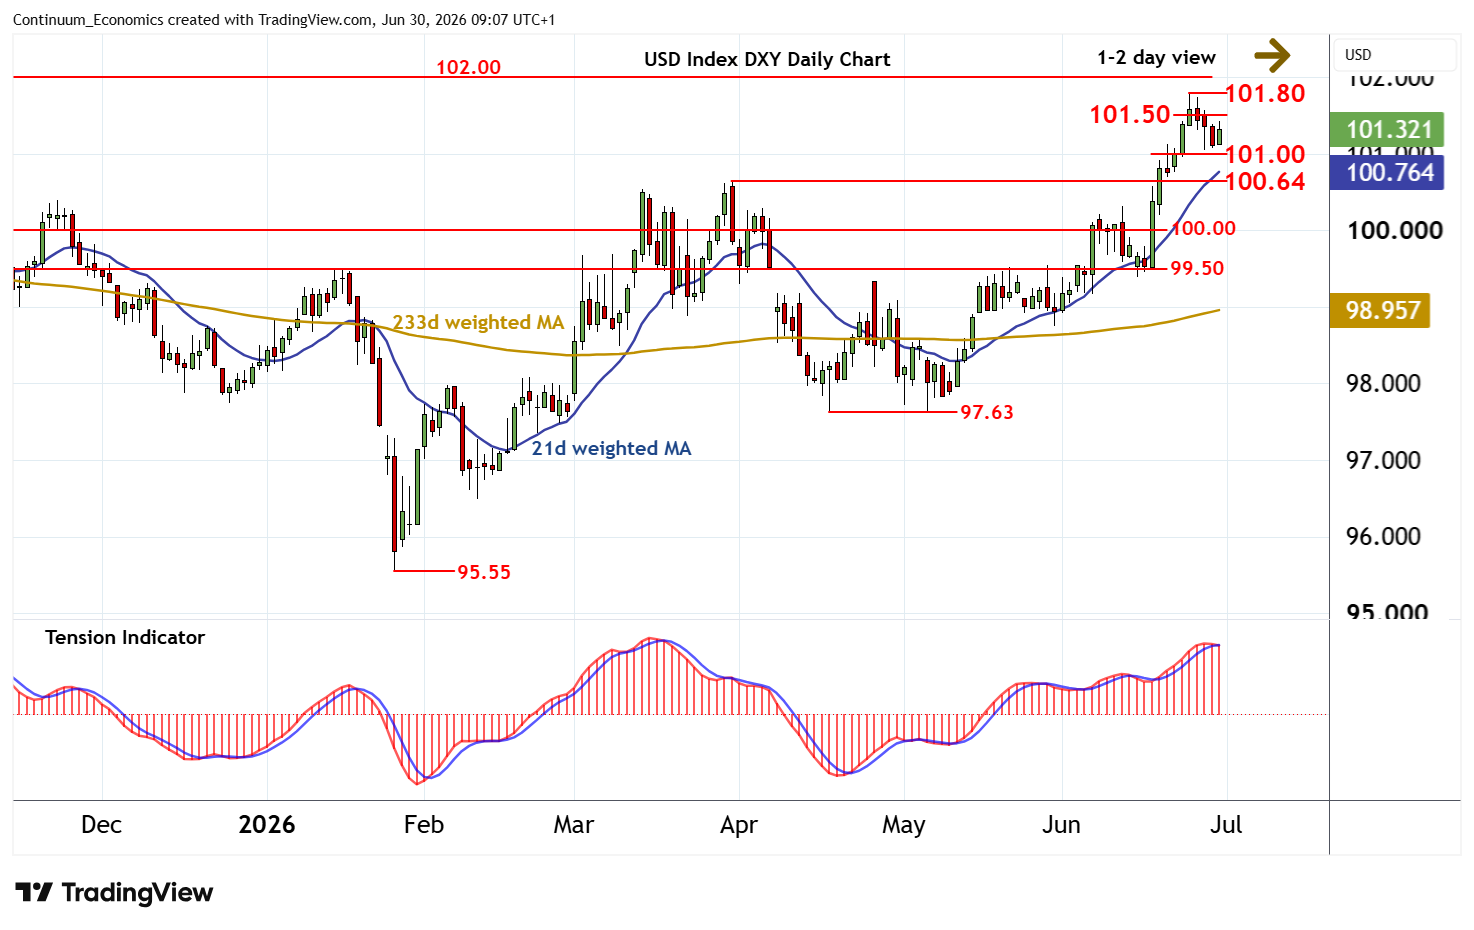
Chart USD Index DXY Update: Consolidating - limited downside tests
Still little change, as prices extend cautious trade within the 101.00 - 101.50 range
| Levels | Imp | Comment | Levels | Imp | Comment | |||
|---|---|---|---|---|---|---|---|---|
| R4 | 102.85/00 | 50% ret of 2025-2026 fall; cong | S1 | 101.00 | ** | minor congestion | ||
| R3 | 102.00 | ** | congestion | S2 | 100.64 | ** | 31 Mar (m) high | |
| R2 | 101.80 | * | 24 Jun YTD high | S3 | 100.00 | ** | congestion | |
| R1 | 101.50 | intraday break level | S4 | 99.50 | * | congestion |
Asterisk denotes strength of level
09:00 BST - Still little change, as prices extend cautious trade within the 101.00 - 101.50 range. Rising intraday studies are putting focus on resistance at 101.50. But unwinding overbought daily stochastics and the flat/negative daily Tension Indicator should limit any immediate break in renewed consolidation beneath critical resistance at the 101.80 current year high of 24 June, before rising weekly charts prompt further gains. A close above here will turn sentiment positive and extend January gains beyond congestion around 102.00 towards 102.85/00. Meanwhile, a break below congestion support at 101.00 should give way to consolidation above the 100.64 monthly high of 31 March.