Chart USD/RUB Update: Consolidating gains - daily studies under pressure
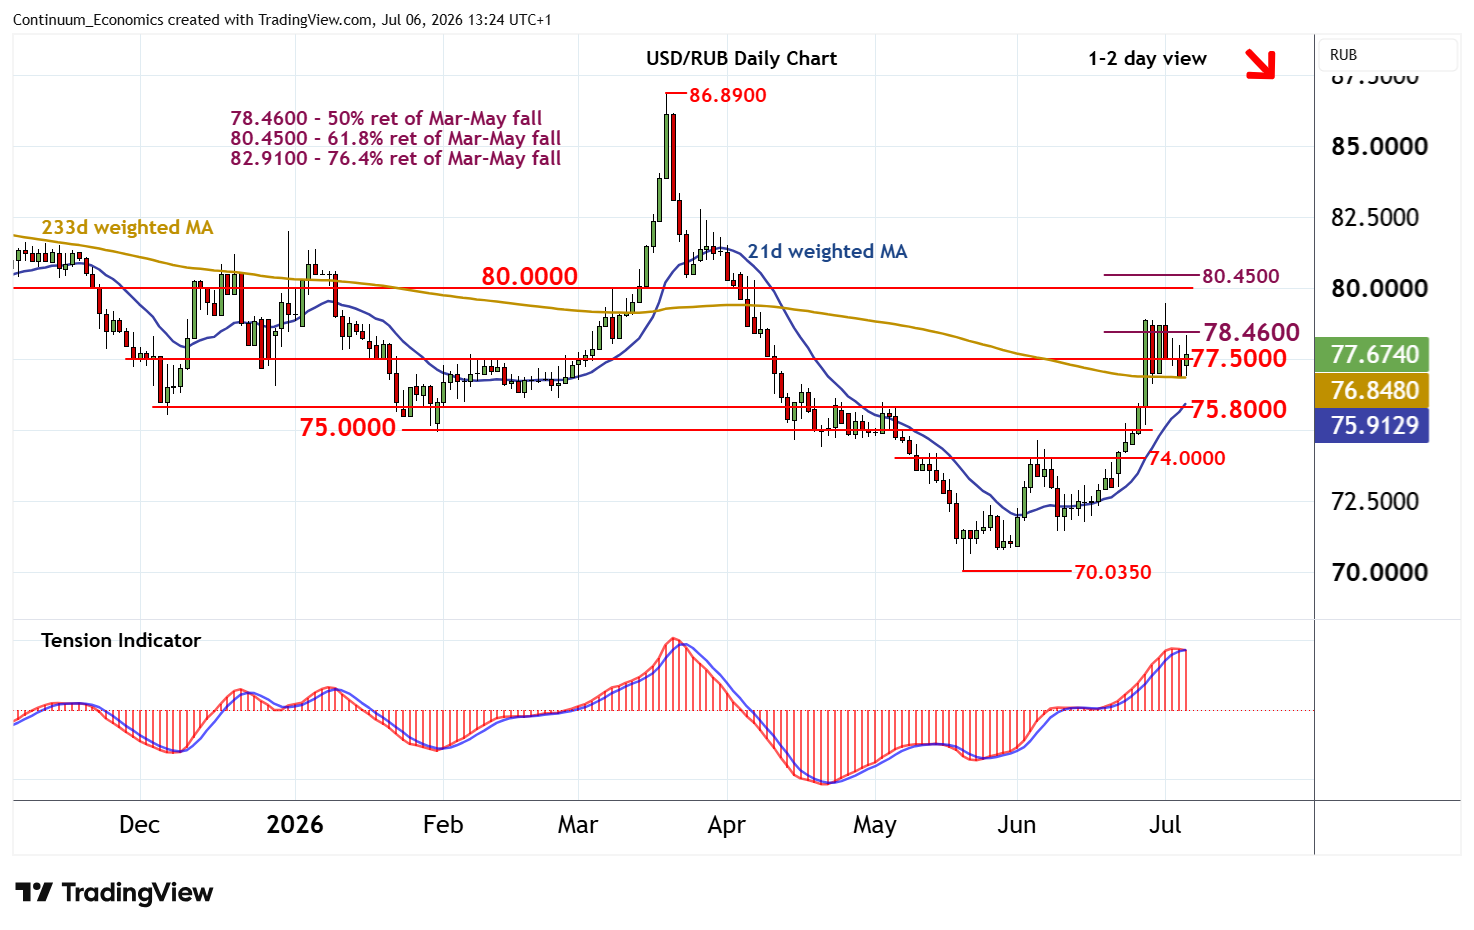
The anticipated break above the 78.4600 Fibonacci retracement has been pushed back from 79.4900
| Levels | Comment | Levels | Comment | |||||
| R4 | 80.4500 | ** | 61.8% ret of Mar-May fall | S1 | 77.5000 | ** | congestion | |
| R3 | 80.0000 | ** | break level | S2 | 75.8000 | * | congestion tops | |
| R2 | 79.4900 | * | 1 Jul (w) high | S3 | 75.0000 | ** | congestion | |
| R1 | 78.4600 | ** | 50% ret of Mar-May fall | S4 | 74.0000 | * | congestion |
Asterisk denotes strength of level
13:10 BST - The anticipated break above the 78.4600 Fibonacci retracement has been pushed back from 79.4900, as intraday studies turn down, with prices currently balanced around congestion support at 77.5000. Daily stochastics are falling and the positive daily Tension Indicator is also turning down, highlighting room for a break beneath here towards support at 75.8000. However, rising weekly charts should limit any deeper reactions in renewed buying interest/consolidation above congestion around 75.0000. Meanwhile, a close back above 78.4600 would help to improve sentiment and extend late-May gains beyond 79.4900 towards 80.0000.