Published: 2026-06-26T00:53:29.000Z
Chart USD/JPY Update: Pressuring 161.95 resistance
-
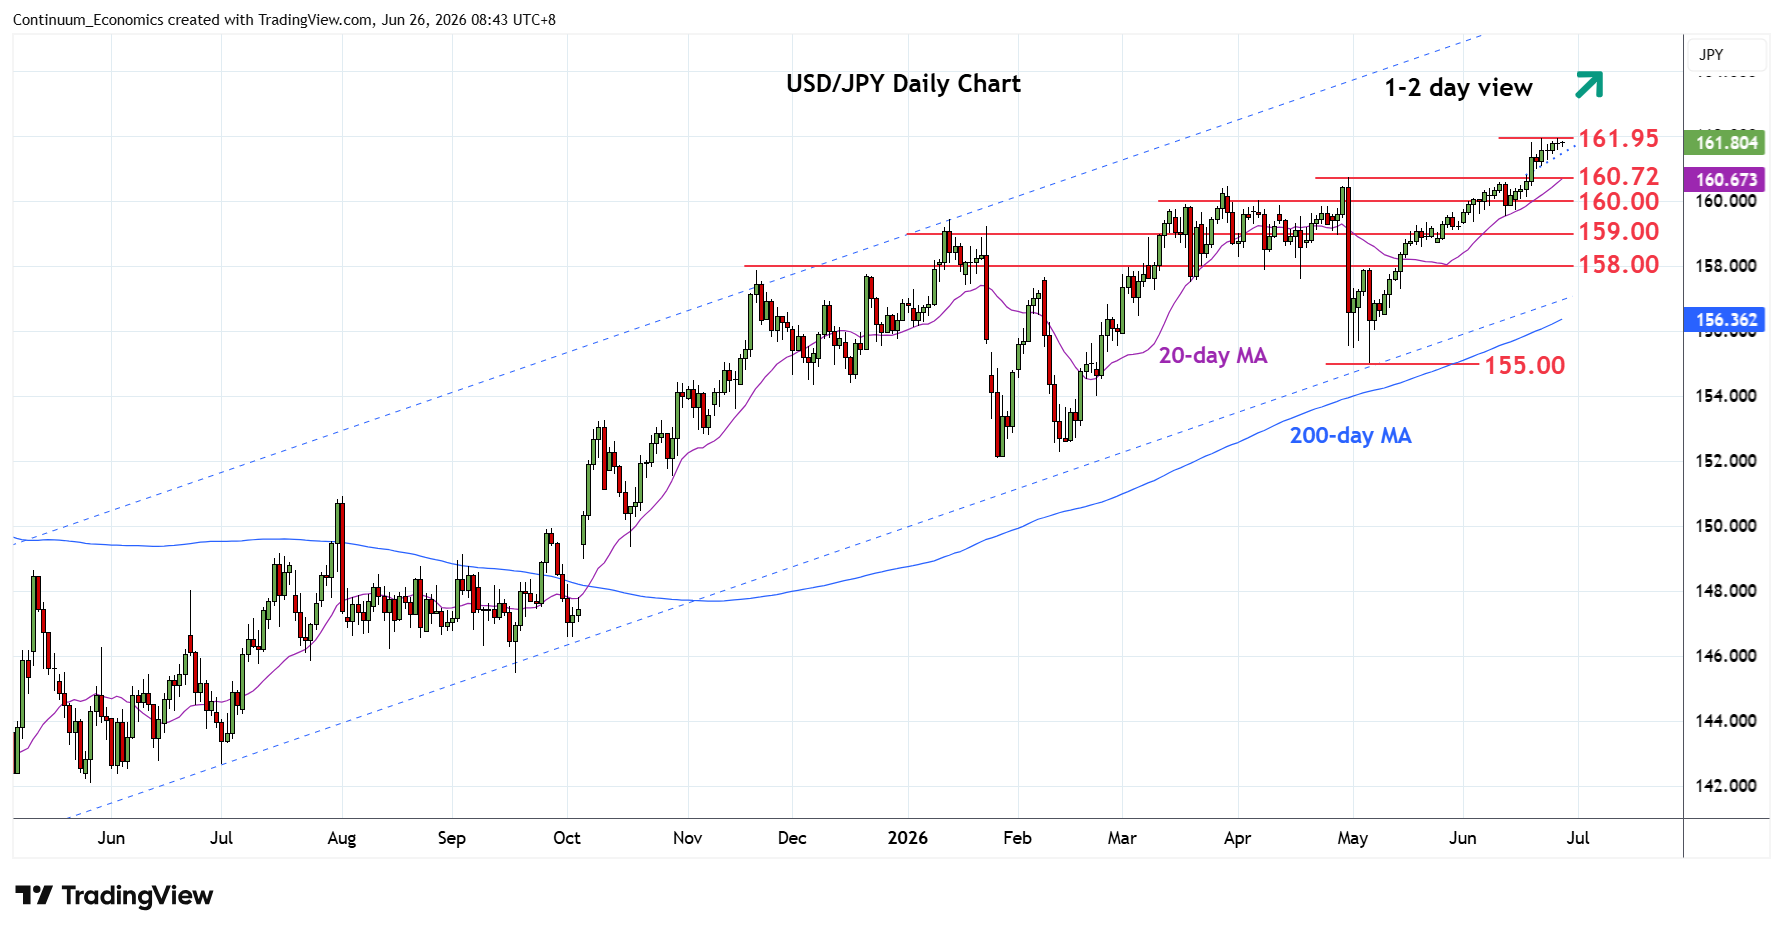
Pressuring the upside to tag the 161.95, July 2024 multi-year high
| Levels | Imp | Comment | Levels | Imp | Comment | |||
|---|---|---|---|---|---|---|---|---|
| R4 | 164.95 | ** | Nov 1986 high | S1 | 161.00 | * | 19 Jun low | |
| R3 | 164.00 | * | Dec 1986 high | S2 | 160.72 | ** | Apr high | |
| R2 | 163.00 | * | congestion from Dec 1986 | S3 | 160.00 | * | figure | |
| R1 | 161.95 | ** | Jul 2024 multi-year high | S4 | 159.53 | * | 11 Jun low |
Asterisk denotes strength of level
00:50 GMT - Pressuring the upside to tag the 161.95, July 2024 multi-year high. The resulting ascending triangle above the 161.00 level suggest potential for break to extend bullish gains from the 155.00 May low. Clearance will extend the underlying bull trend and see room towards 163.00/164.00 congestion area and high of December 1986. Meanwhile, support remains at the 161.00/160.72 area which should underpin. Would take break here to ease the upside pressure and open up room for deeper corrective pullback to support at 160.00/159.53 area.