Published: 2026-10-02T07:54:59.000Z
Chart USD/JPY Update: Choppy trade as studies turns mixed
2
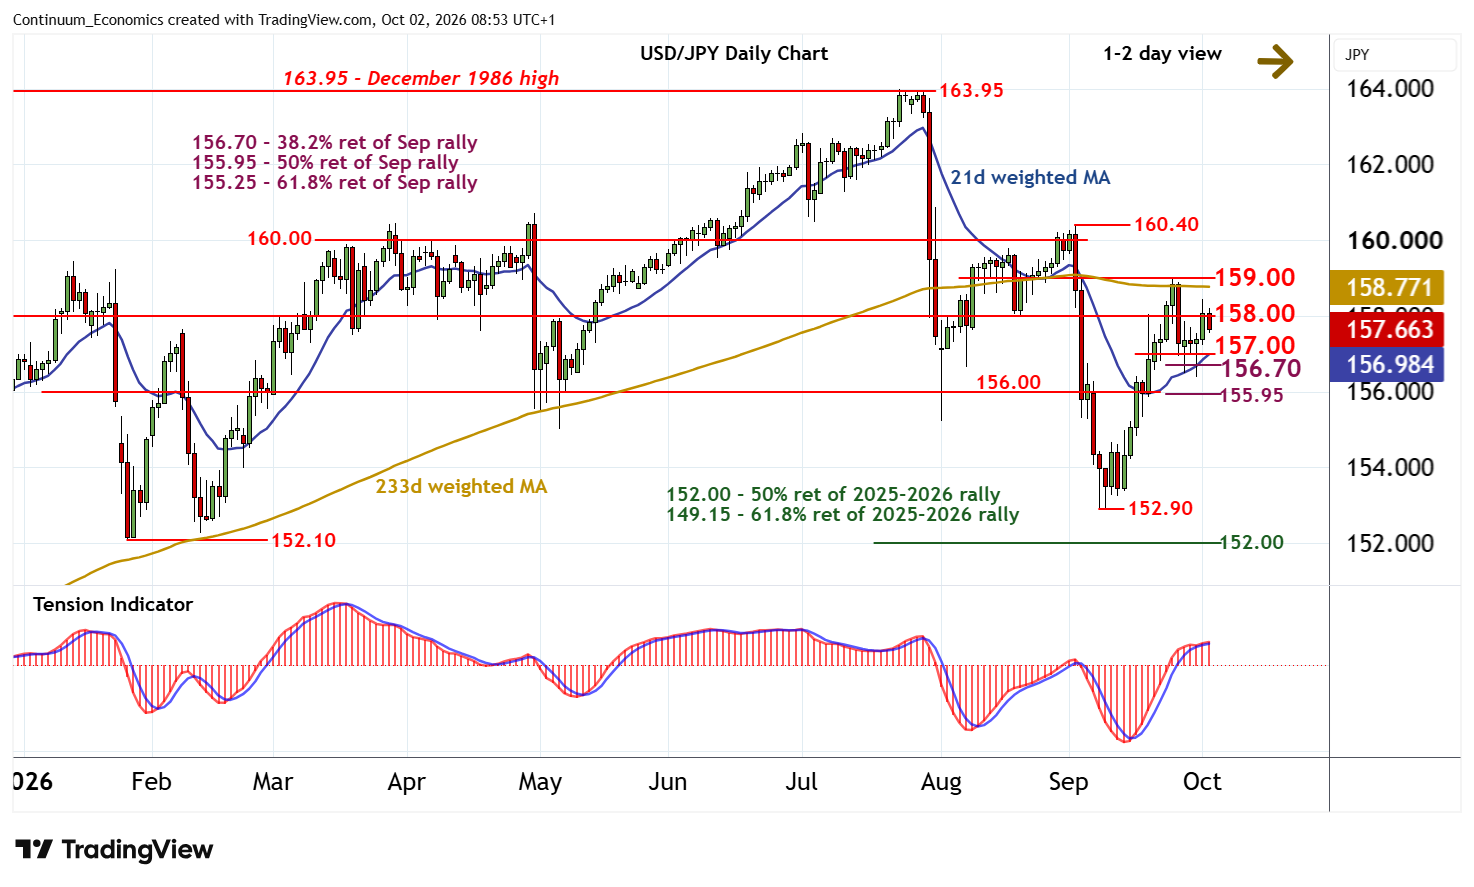
The anticipated test of congestion resistance at 159.00 has not been seen
| Levels | Imp | Comment | Levels | Imp | Comment | |||
|---|---|---|---|---|---|---|---|---|
| R4 | 160.40 | ** | 2 Sep (m) high | S1 | 157.00 | congestion | ||
| R3 | 160.00 | ** | congestion | S2 | 156.70 | * | 38.2% ret of Sep rally | |
| R2 | 159.00 | * | congestion | S3 | 155.95/00 | ** | 50% ret; congestion | |
| R1 | 158.00 | ** | congestion | S4 | 155.25 | ** | 61.8% ret of Sep rally |
Asterisk denotes strength of level
08:40 BST - The anticipated test of congestion resistance at 159.00 has not been seen, as choppy trade around 158.00 gives way to a drift lower. Intraday studies are turning down and flat daily stochastics are also ticking lower, suggesting room for a drift down to congestion support at 157.00. But the positive daily Tension Indicator and unwinding oversold weekly stochastics should limit any initial tests in consolidation, before bearish longer-term charts prompt further losses.
Meanwhile, a break above above congestion resistance at 159.00 should be limited in consolidation beneath further congestion around 159.00.