Published: 2026-08-07T08:10:54.000Z
Chart USD Index DXY Update: Any gains to remain limited
2
The anticipated test of congestion resistance at 100.00 is giving way to consolidation
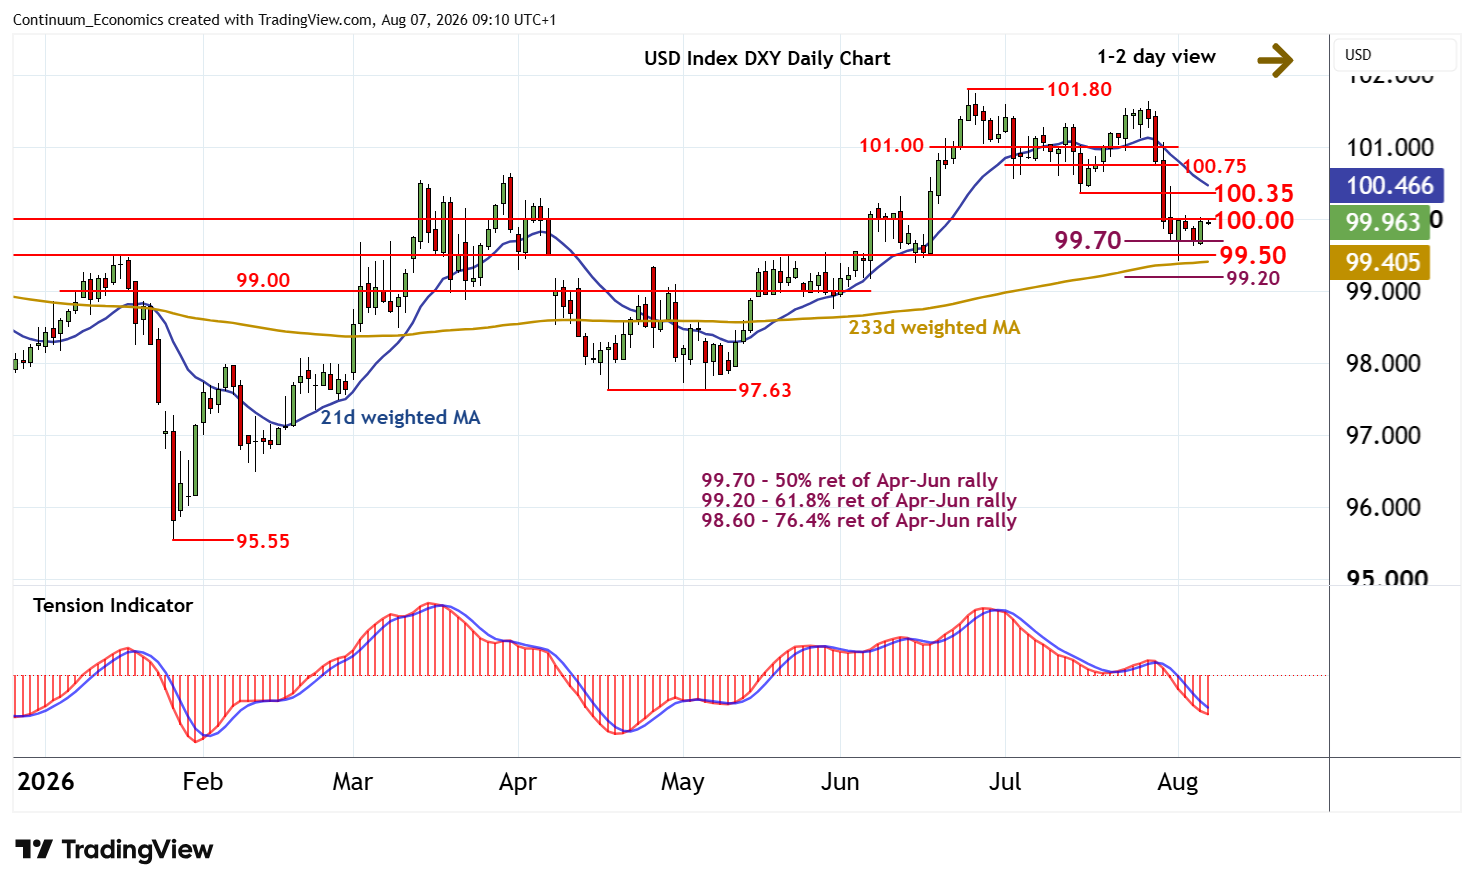
| Levels | Imp | Comment | Levels | Imp | Comment | |||
|---|---|---|---|---|---|---|---|---|
| R4 | 101.00 | ** | congestion base | S1 | 99.70 | ** | 50% ret of Apr-Jun rally | |
| R3 | 100.75 | congestion | S2 | 99.50 | ** | congestion | ||
| R2 | 100.35 | ** | 15 Jul (w) low | S3 | 99.20 | ** | 61.8% ret of Apr-Jun rally | |
| R1 | 100.00 | ** | congestion | S4 | 99.00 | ** | congestion |
Asterisk denotes strength of level
09:05 BST - The anticipated test of congestion resistance at 100.00 is giving way to consolidation, overbought intraday studies flatten. Oversold daily stochastics are rising, suggesting room for a test above here. But the bearish daily Tension Indicator and negative weekly charts should limit scope in renewed selling interest beneath the 100.35 weekly low of 15 July. Following cautious/corrective trade, fresh losses are looked for. A later close below the 99.70 Fibonacci retracement will put focus on congestion around 99.50. Continuation beneath here will extend late-June losses towards the 99.20 retracement.