Published: 2026-06-15T07:21:13.000Z
Chart AUD/JPY Update: Higher in consolidation from 112.00 low
1
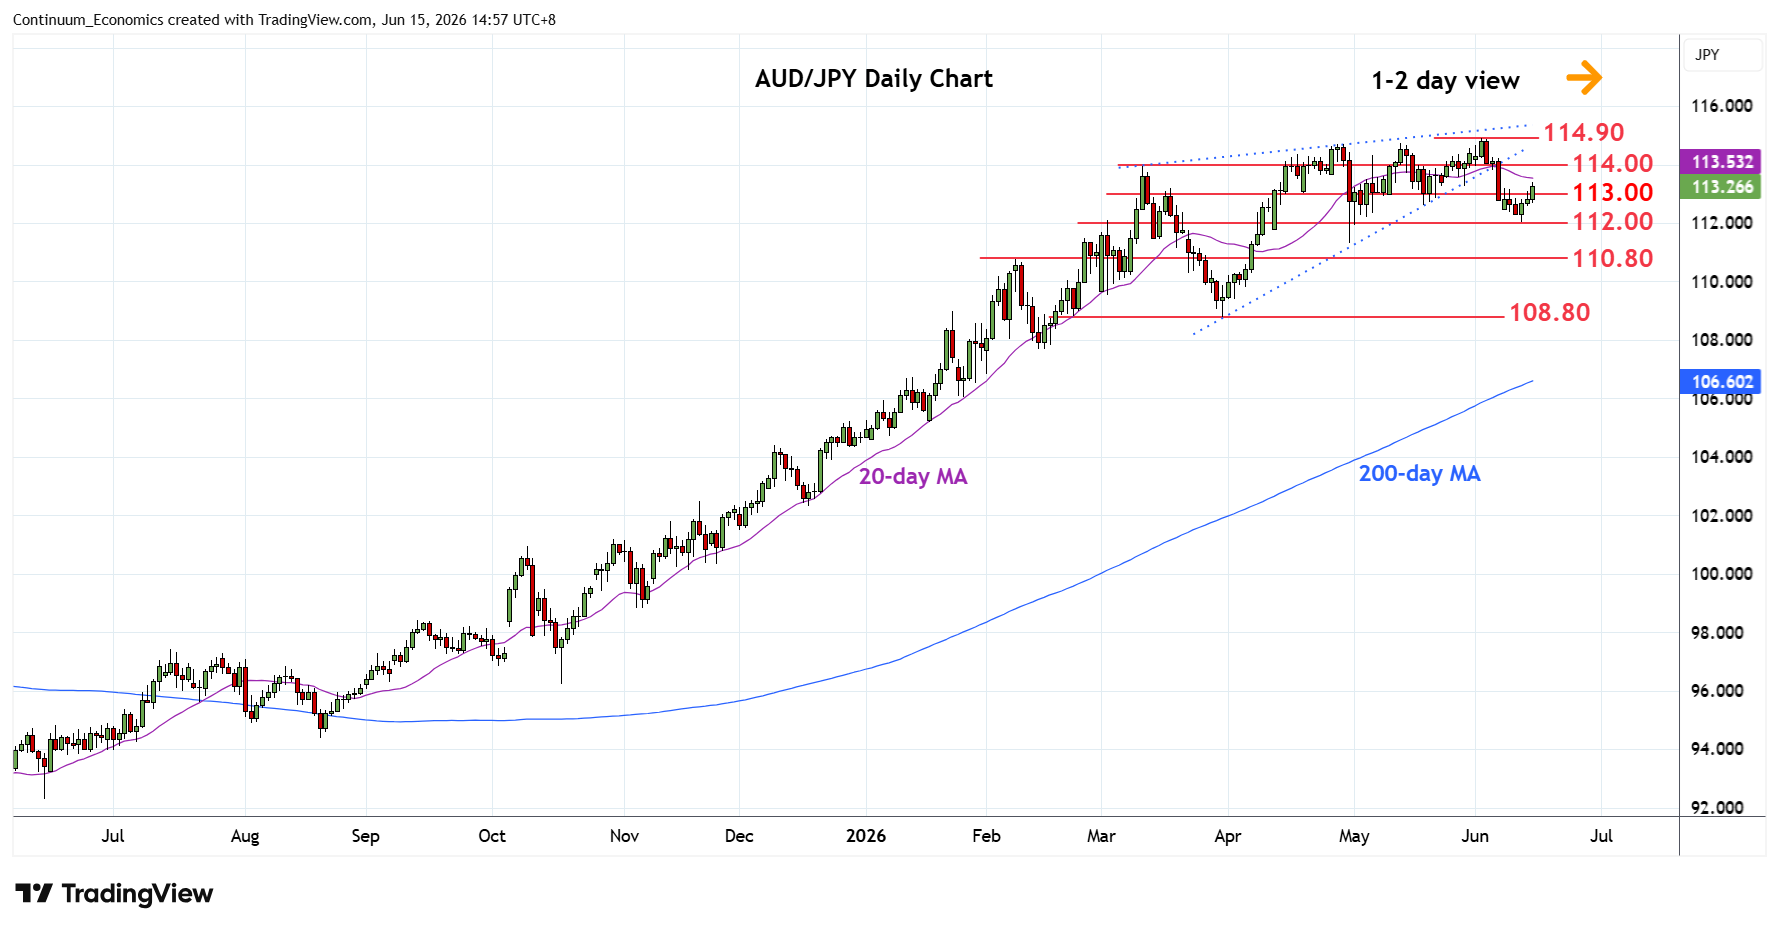
Extending bounce from the 112.00 low as prices consolidate losses from the 114.90 high of 2 June
| Levels | Imp | Comment | Levels | Imp | Comment | |||
|---|---|---|---|---|---|---|---|---|
| R4 | 116.00 | * | congestion | S1 | 112.50 | 8 Jun low | ||
| R3 | 115.00 | * | congestion | S2 | 112.00 | ** | congestion | |
| R2 | 114.90 | ** | 2 Jun YTD high | S3 | 111.30 | ** | 30 Apr low | |
| R1 | 114.00 | ** | congestion | S4 | 110.80 | * | 9 Feb high |
Asterisk denotes strength of level
07:15 GMT - Extending bounce from the 112.00 low as prices consolidate losses from the 114.90 high of 2 June. Daily studies have turned up from oversold areas and regaining the 113.00 level see room to retest strong resistance at the 113.50/114.00 congestion and previous wedge support which is expected to cap. Meanwhile, support remains at the 112.50/112.00 area which should underpin. Would take break of 112.00 to open up room for retest of strong support at the 111.30/110.80 area.